10.6.1 プロジェクトロードマップ:ビジョン証拠パックを作る
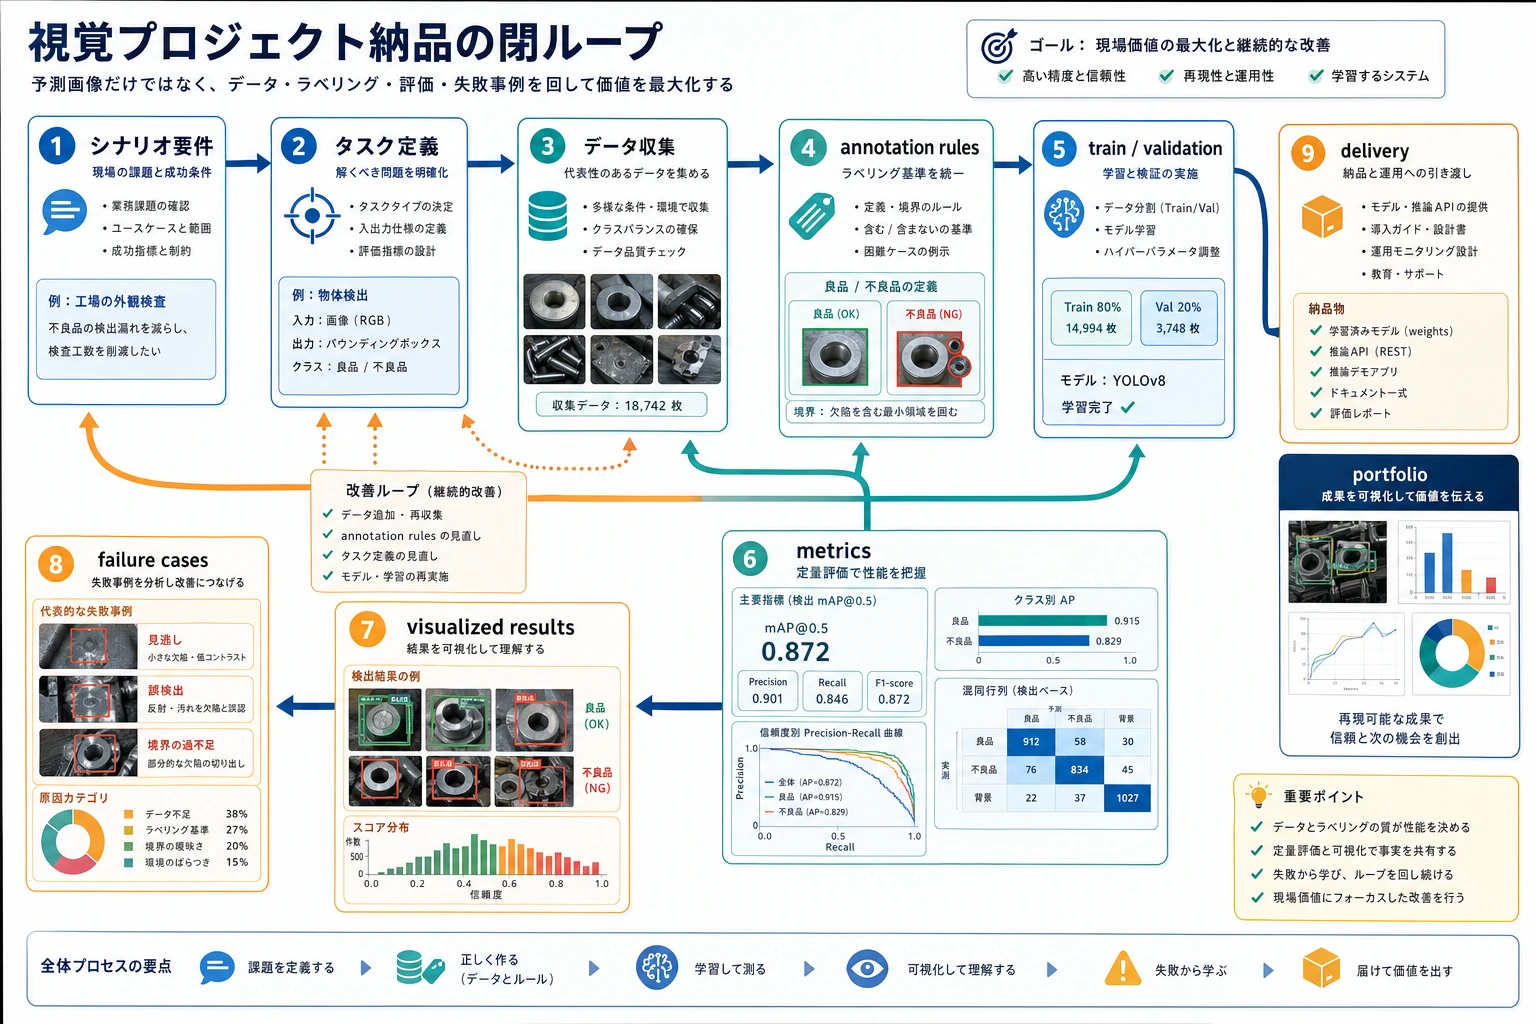
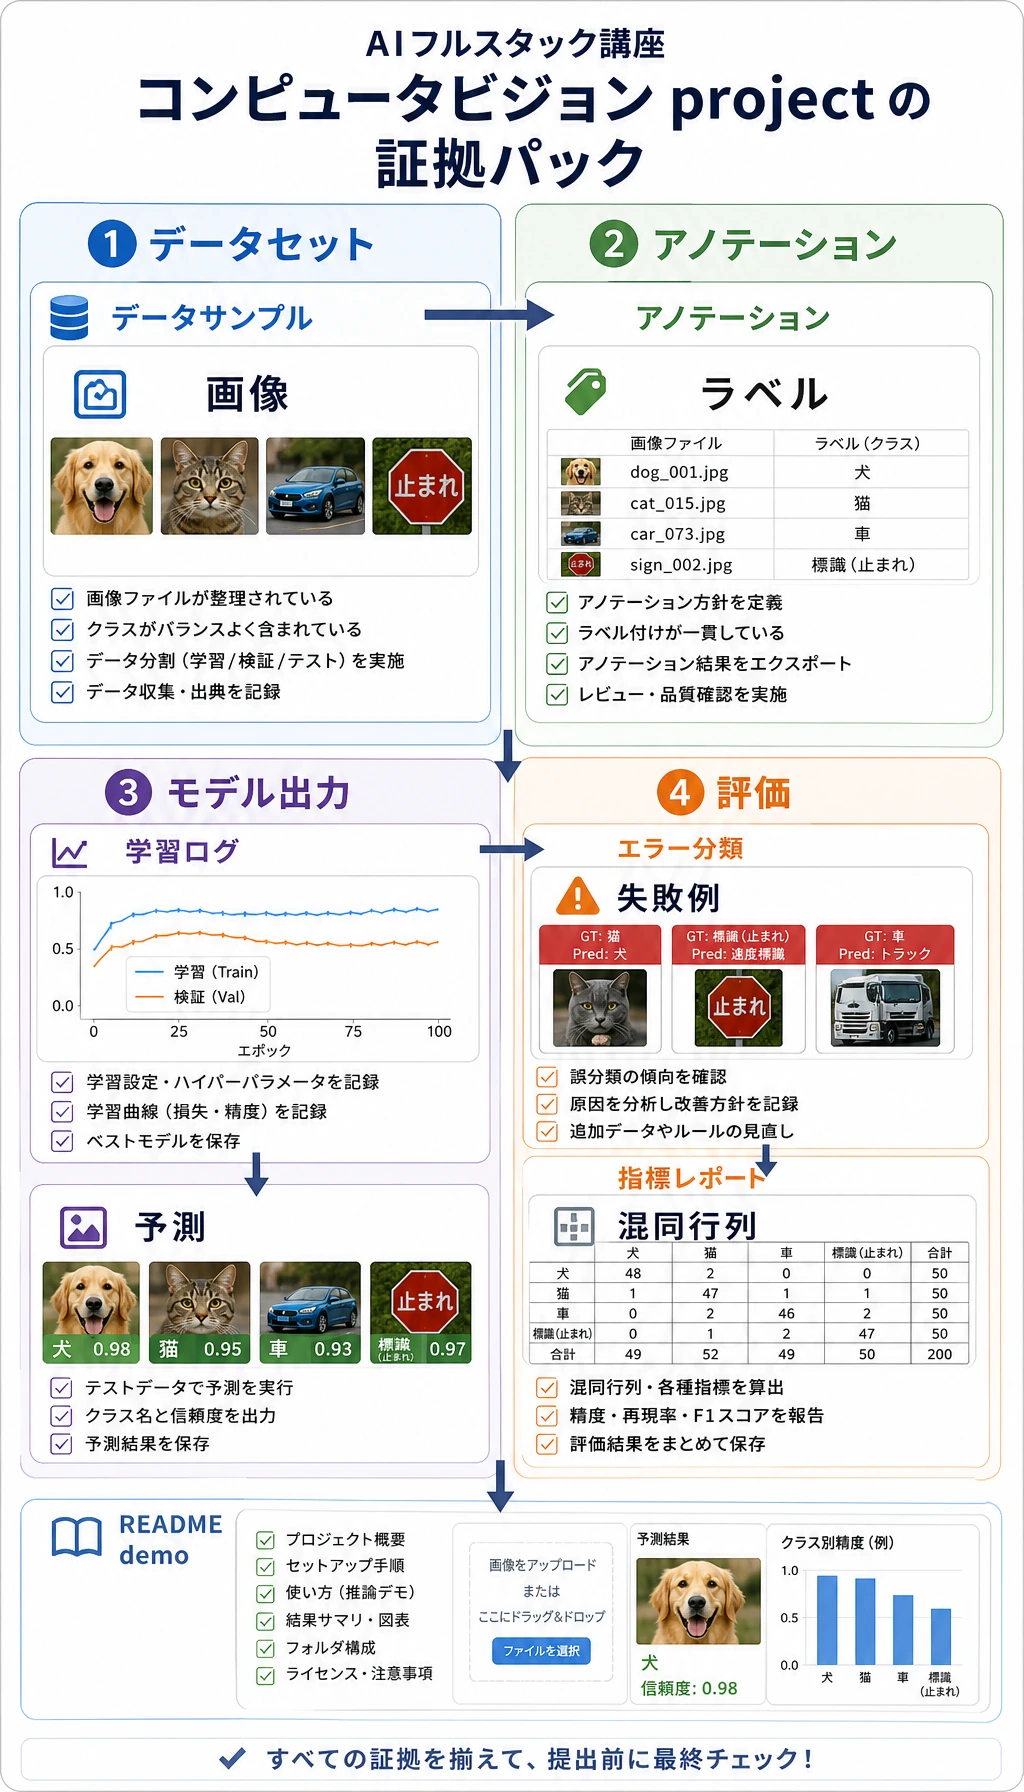
コンピュータビジョンプロジェクトは「モデルを使った」だけではありません。データ、アノテーション、モデル出力、指標、失敗例、発表をつなぐループです。
まずプロジェクトループを見る
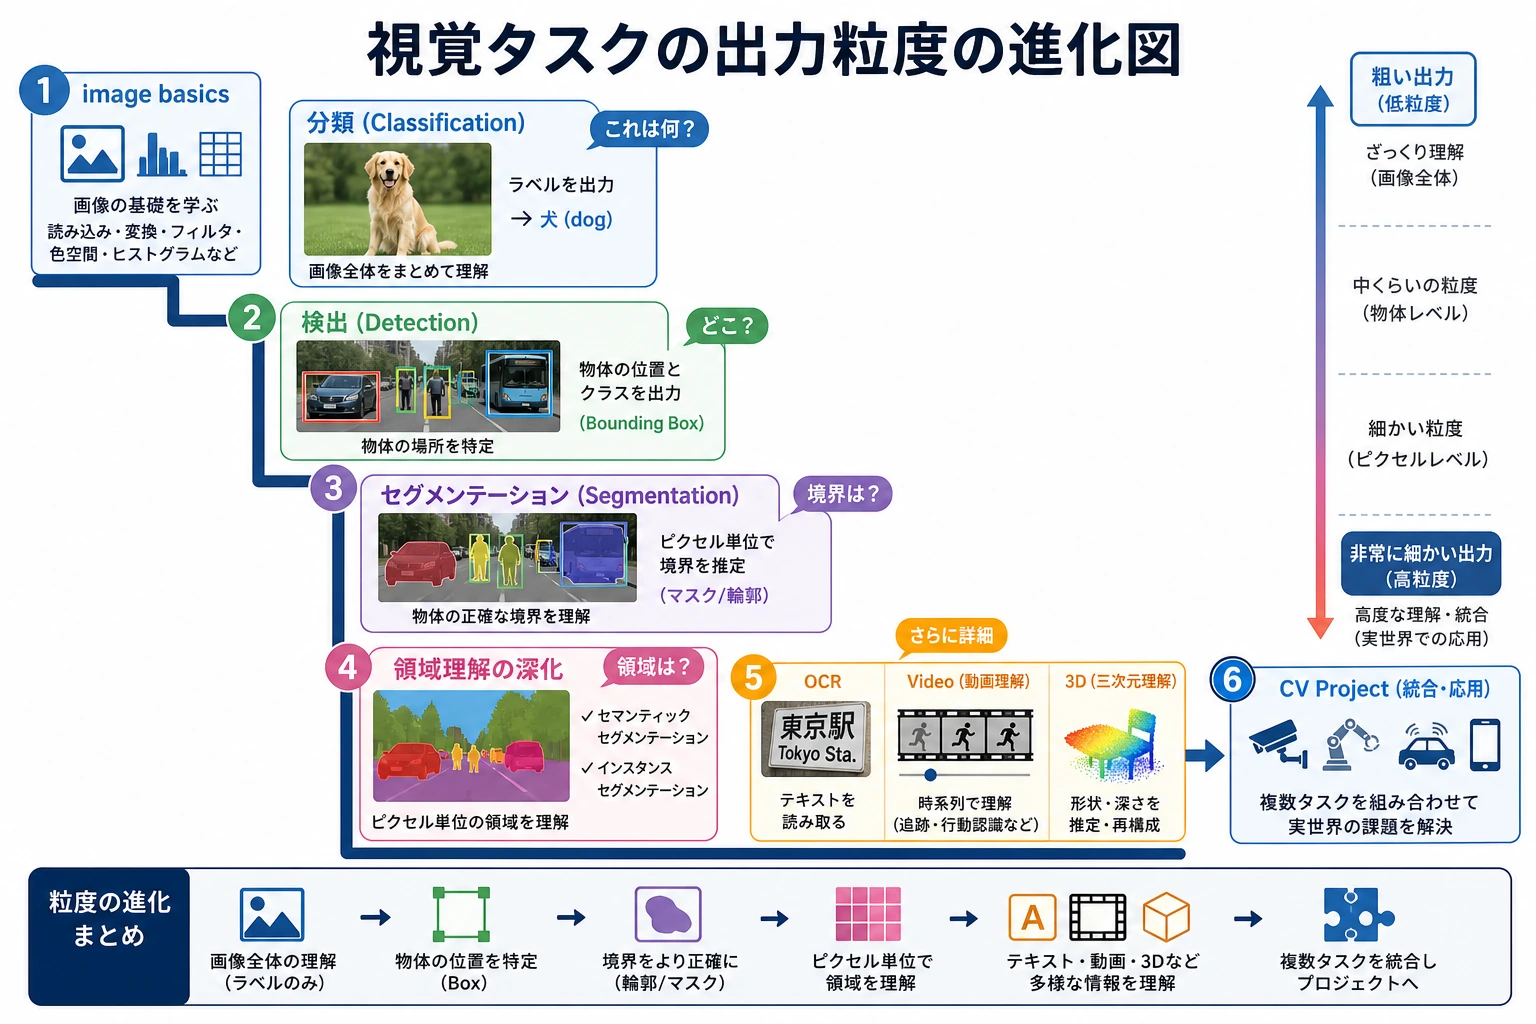
最速で完結したループを作るなら分類から始めます。ボックスが必要なら検出、マスクが必要なら分割、OCR・動画・3D はより専門的な場面で使います。
プロジェクト準備チェックを動かす
人に見せられるプロジェクトと呼ぶ前に、このチェックを使います。
project = {
    "task": "helmet detection",
    "has_data_note": True,
    "has_metric": True,
    "has_failure_case": True,
    "has_annotation_rule": True,
}

ready = all(project[key] for key in ["has_data_note", "has_metric", "has_failure_case", "has_annotation_rule"])

print("task:", project["task"])
print("presentable:", ready)
出力:
task: helmet detection
presentable: True
annotation rule や failure case がない project は、まだ demo であり portfolio project ではありません。
この順番で学ぶ
| 手順 | Project Type | Evidence |
|---|---|---|
| 1 | Classification | dataset split、accuracy/F1、confusion examples |
| 2 | Detection | box annotations、IoU/mAP、false positives and missed detections |
| 3 | Segmentation | masks、IoU/Dice、boundary failures |
| 4 | Industry scenario | risk notes、user impact、deployment idea |
| 5 | Hands-on workshop | larger project pages の前に reproducible mini pipeline |
project を広げる前に、10.6.4 実践:再現可能な Vision Mini Pipeline を作る を実行します。
プロジェクト成果物基準
| 成果物 | 最低要件 | 強いポートフォリオ版 |
|---|---|---|
| README | goal、run command、dependencies、examples | task boundary、data source、deployment idea を追加 |
| Data and annotation | image source、class list、annotation format | annotation examples、quality checks、bias notes を追加 |
| Results | 1 枚以上の input image と prediction result | correct、false positive、false negative、boundary cases を追加 |
| Evaluation | Accuracy、F1、mAP、IoU、Dice、OCR hit rate | class、scenario、lighting、clarity ごとの error analysis を追加 |
| Failure analysis | 1 件以上の real failure | suspected cause、fix action、regression check を追加 |
| Presentation | screenshot または short GIF で動作を証明 | 明確な visual project page を作る |
合格ライン
vision project が再現可能で、明確な data and annotation rules、適切な metrics、model failure の例を持っていれば、この章は合格です。