6.8.2 プロジェクト:画像分類システム
この節の位置づけ
画像分類 project が portfolio として伝わるのは、モデル名が高度だからではありません。他の人が label を理解し、baseline を動かし、metrics を見て、failure を確認できるからです。
学習目標
- class boundary が明確な分類 task を定義できる。
- train/validation/test の evidence を整理できる。
- 予測を出す小さな baseline を動かせる。
- confusion matrix を作り、error cases を取り出せる。
- 実際の CNN や transfer-learning project で何を見せるべきか分かる。
まず Project Loop を見る
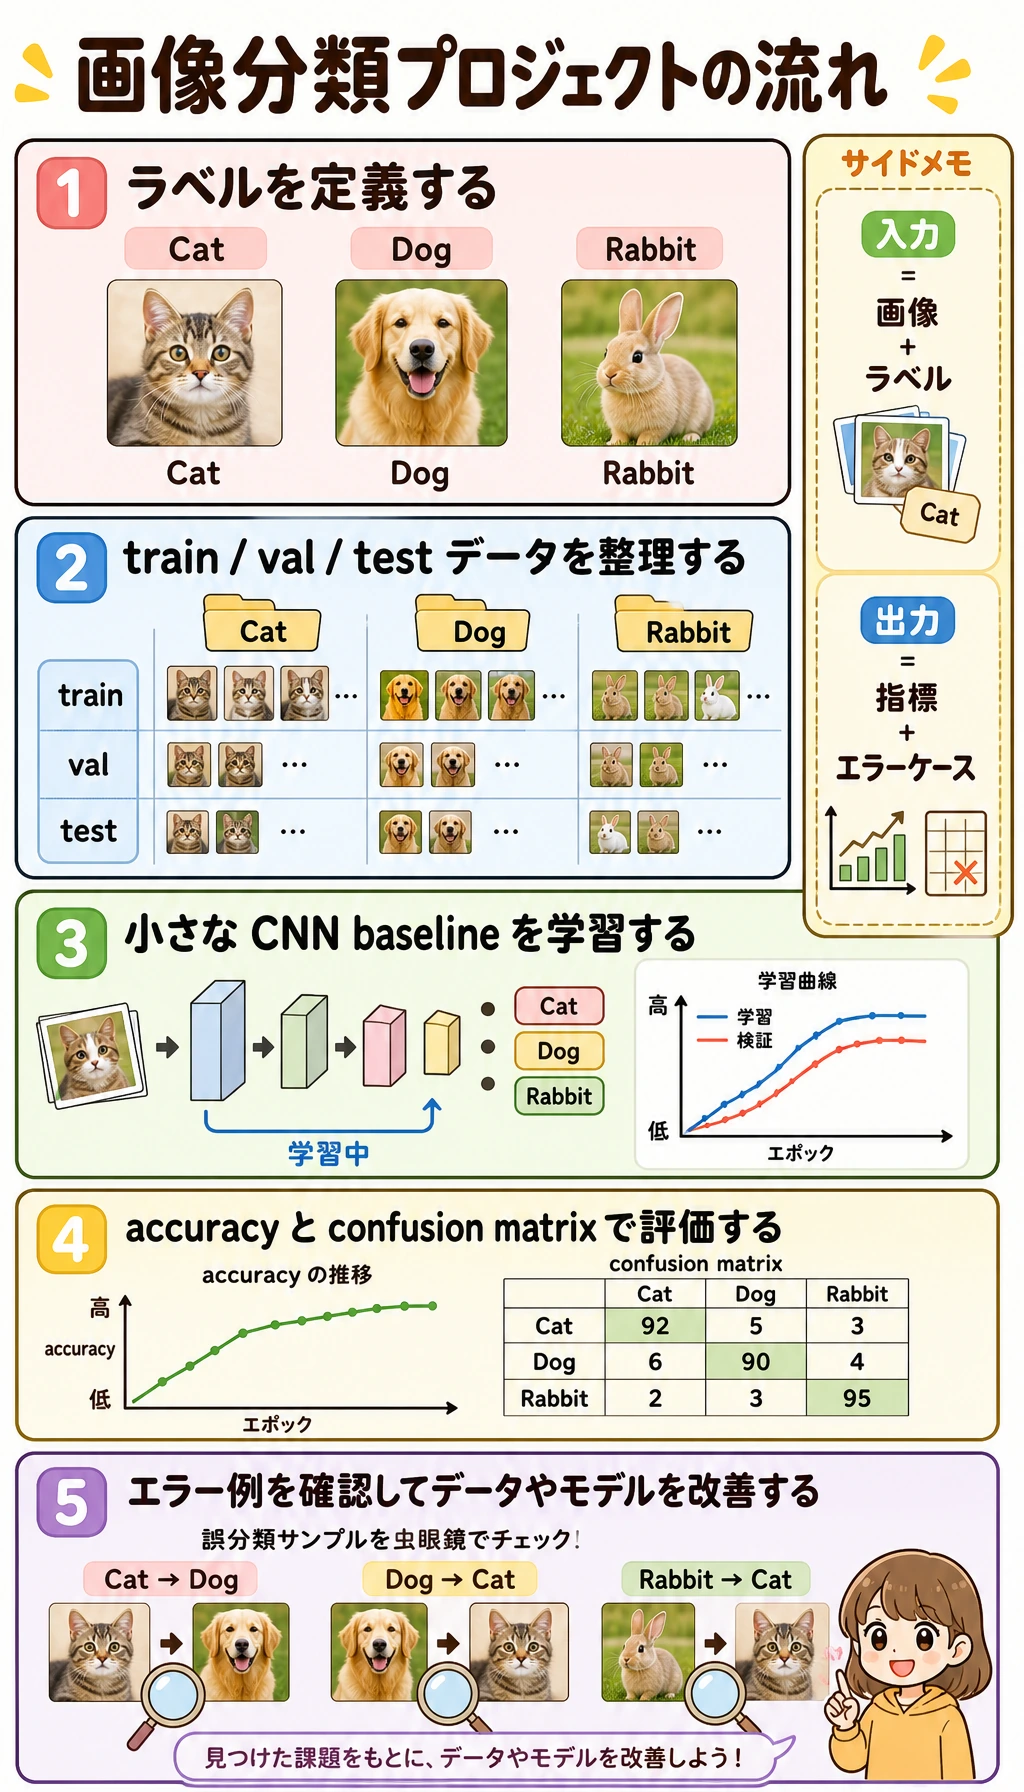
labels -> data split -> baseline -> metrics -> error cases -> next data/model action
topic は次を満たすものにします。
- class boundary が明確。
- data を実際に集められる。
- mistake を説明できる。
最初から数百の細かい class や、人間でも意見が割れる label にはしない方が安全です。
Project Plan Template
from dataclasses import dataclass, field


@dataclass
class CVProjectPlan:
    name: str
    classes: list[str]
    dataset_split: dict[str, int]
    baseline: str
    metrics: list[str]
    risks: list[str] = field(default_factory=list)


plan = CVProjectPlan(
    name="pet_image_classifier",
    classes=["cat", "dog", "rabbit"],
    dataset_split={"train": 900, "val": 180, "test": 180},
    baseline="small_cnn_then_transfer_learning",
    metrics=["accuracy", "confusion_matrix", "error_cases"],
    risks=["class imbalance", "background leakage", "label noise"],
)

print(plan)
これは project の境界を決める object です。これを埋められないなら、model choice はまだ早いです。
実験:Prototype Baseline と Confusion Matrix
この toy example は、実画像の代わりに 3 つの pseudo-features を使います。あとで CNN でも使う evaluation loop を学ぶためのものです。
image_project_baseline.py を作成します。
from collections import defaultdict

train_data = [
    ("cat", [0.9, 0.8, 0.4]),
    ("cat", [0.8, 0.7, 0.5]),
    ("dog", [0.7, 0.5, 0.8]),
    ("dog", [0.6, 0.4, 0.9]),
    ("rabbit", [0.5, 0.9, 0.3]),
    ("rabbit", [0.4, 0.8, 0.2]),
]

val_data = [
    ("cat", [0.85, 0.75, 0.45]),
    ("dog", [0.65, 0.45, 0.85]),
    ("rabbit", [0.45, 0.85, 0.25]),
    ("dog", [0.82, 0.72, 0.42]),
]

labels = ["cat", "dog", "rabbit"]


def prototypes(data):
    groups = defaultdict(list)
    for label, features in data:
        groups[label].append(features)

    result = {}
    for label, rows in groups.items():
        result[label] = [
            round(sum(row[i] for row in rows) / len(rows), 3)
            for i in range(len(rows[0]))
        ]
    return result


def l1(a, b):
    return sum(abs(x - y) for x, y in zip(a, b))


def predict(features, protos):
    distances = {label: round(l1(features, proto), 3) for label, proto in protos.items()}
    pred = min(distances, key=distances.get)
    return pred, distances


protos = prototypes(train_data)
print("prototypes")
for label in labels:
    print(label, protos[label])

rows = []
for gold, features in val_data:
    pred, distances = predict(features, protos)
    rows.append({"gold": gold, "pred": pred})
    print("prediction", gold, "->", pred, distances)

cm = {g: {p: 0 for p in labels} for g in labels}
for row in rows:
    cm[row["gold"]][row["pred"]] += 1

print("confusion_matrix")
for gold in labels:
    print(gold, [cm[gold][p] for p in labels])

errors = [row for row in rows if row["gold"] != row["pred"]]
print("accuracy:", round((len(rows) - len(errors)) / len(rows), 3))
print("errors:", errors)
実行します。
python image_project_baseline.py
期待される出力:
prototypes
cat [0.85, 0.75, 0.45]
dog [0.65, 0.45, 0.85]
rabbit [0.45, 0.85, 0.25]
prediction cat -> cat {'cat': 0.0, 'dog': 0.9, 'rabbit': 0.7}
prediction dog -> dog {'cat': 0.9, 'dog': 0.0, 'rabbit': 1.2}
prediction rabbit -> rabbit {'cat': 0.7, 'dog': 1.2, 'rabbit': 0.0}
prediction dog -> cat {'cat': 0.09, 'dog': 0.87, 'rabbit': 0.67}
confusion_matrix
cat [1, 0, 0]
dog [1, 1, 0]
rabbit [0, 0, 1]
accuracy: 0.75
errors: [{'gold': 'dog', 'pred': 'cat'}]
error の読み方:
- 最後の
dogsample はcatprototype に近いです。 - confusion matrix は
dog -> catを示しています。 - 次の action は、すぐ大きな model にすることではありません。dog images に cat-like な背景、pose、label 問題がないか確認します。
実 project の Upgrade Path
| Version | 追加するもの | 見せる evidence |
|---|---|---|
| baseline | small CNN または transfer-learning baseline | train/val curves, accuracy |
| evaluation | confusion matrix と error samples | class-level mistakes |
| robustness | augmentation と leakage checks | before/after comparison |
| portfolio | README と demo command | reproducible run |
実際の CNN project では、少なくとも次を残します。
- dataset directory screenshot または class count table。
- train/validation/test split rule。
- baseline model summary。
- metric table。
- confusion matrix。
- 6 から 12 個の correct/wrong examples。
- next-step plan。
よくある間違い
| 間違い | 直し方 |
|---|---|
| accuracy だけ報告する | confusion matrix と error cases を見せる |
| fuzzy class を選ぶ | data collection 前に label boundary を定義する |
| 似た画像が train/test に leak する | 必要なら source や subject で split する |
| 最初から巨大 model を使う | 小さな baseline を先に作る |
| failure を隠す | failure を次の improvement の根拠にする |
練習
dogの validation sample を 2 つ追加し、confusion matrix をもう一度作ってください。- 新しい class
hamsterを追加してください。labelsと matrix はどう変わりますか。 dog -> caterror について、考えられる data issue を 1 つ書いてください。- README で prototype baseline を small CNN outline に置き換えてください。
- dataset、command、metric、failure cases を含む project checklist を作ってください。
まとめ
- 画像分類 project は model name ではなく full loop で評価されます。
- Confusion matrix は class-level failure を見せます。
- Error cases は恥ずかしいものではなく project evidence です。
- 強い portfolio project は、何が改善し、何がまだ失敗するかを見せます。