4.4 Hands-on: Full Chapter 4 Math Workshop
This workshop turns Chapter 4 into one runnable practice loop. You will not prove every formula here. Instead, you will run a small script that makes the most important math ideas visible: vectors compare similarity, probability measures uncertainty, entropy and loss measure surprise, and gradients tell a parameter how to move.
The script uses only the Python standard library. That keeps the first run easy: no NumPy, no plotting dependency, no notebook setup. It still produces CSV files, SVG charts, and a README so you can inspect the math like a small engineering artifact.
Follow the same pattern in every step: look at the diagram, run the code, then inspect the output file. If a formula feels abstract, ask: what object does it represent, what uncertainty does it measure, or what update does it guide?
What You Will Build
By the end, you will have a folder named ch04_math_workshop_evidence containing:
| File | What it proves |
|---|---|
vector_similarity.csv | You can compute dot product, norm, cosine similarity, and distance for small vectors. |
probability_simulation.csv | You can simulate repeated samples and see sampling fluctuation. |
gradient_descent.csv | You can trace parameter updates step by step. |
math_cards.md | You can translate formulas into AI model language. |
vector_similarity.svg | You can see a vector comparison instead of only reading a formula. |
probability_simulation.svg | You can see observed probability moving around the expected probability. |
gradient_descent.svg | You can see loss falling during optimization. |
README.md | You can explain how to rerun and review the experiment. |
Visual Checkpoint: The Whole Route
Before writing code, use these diagrams as the workshop map.
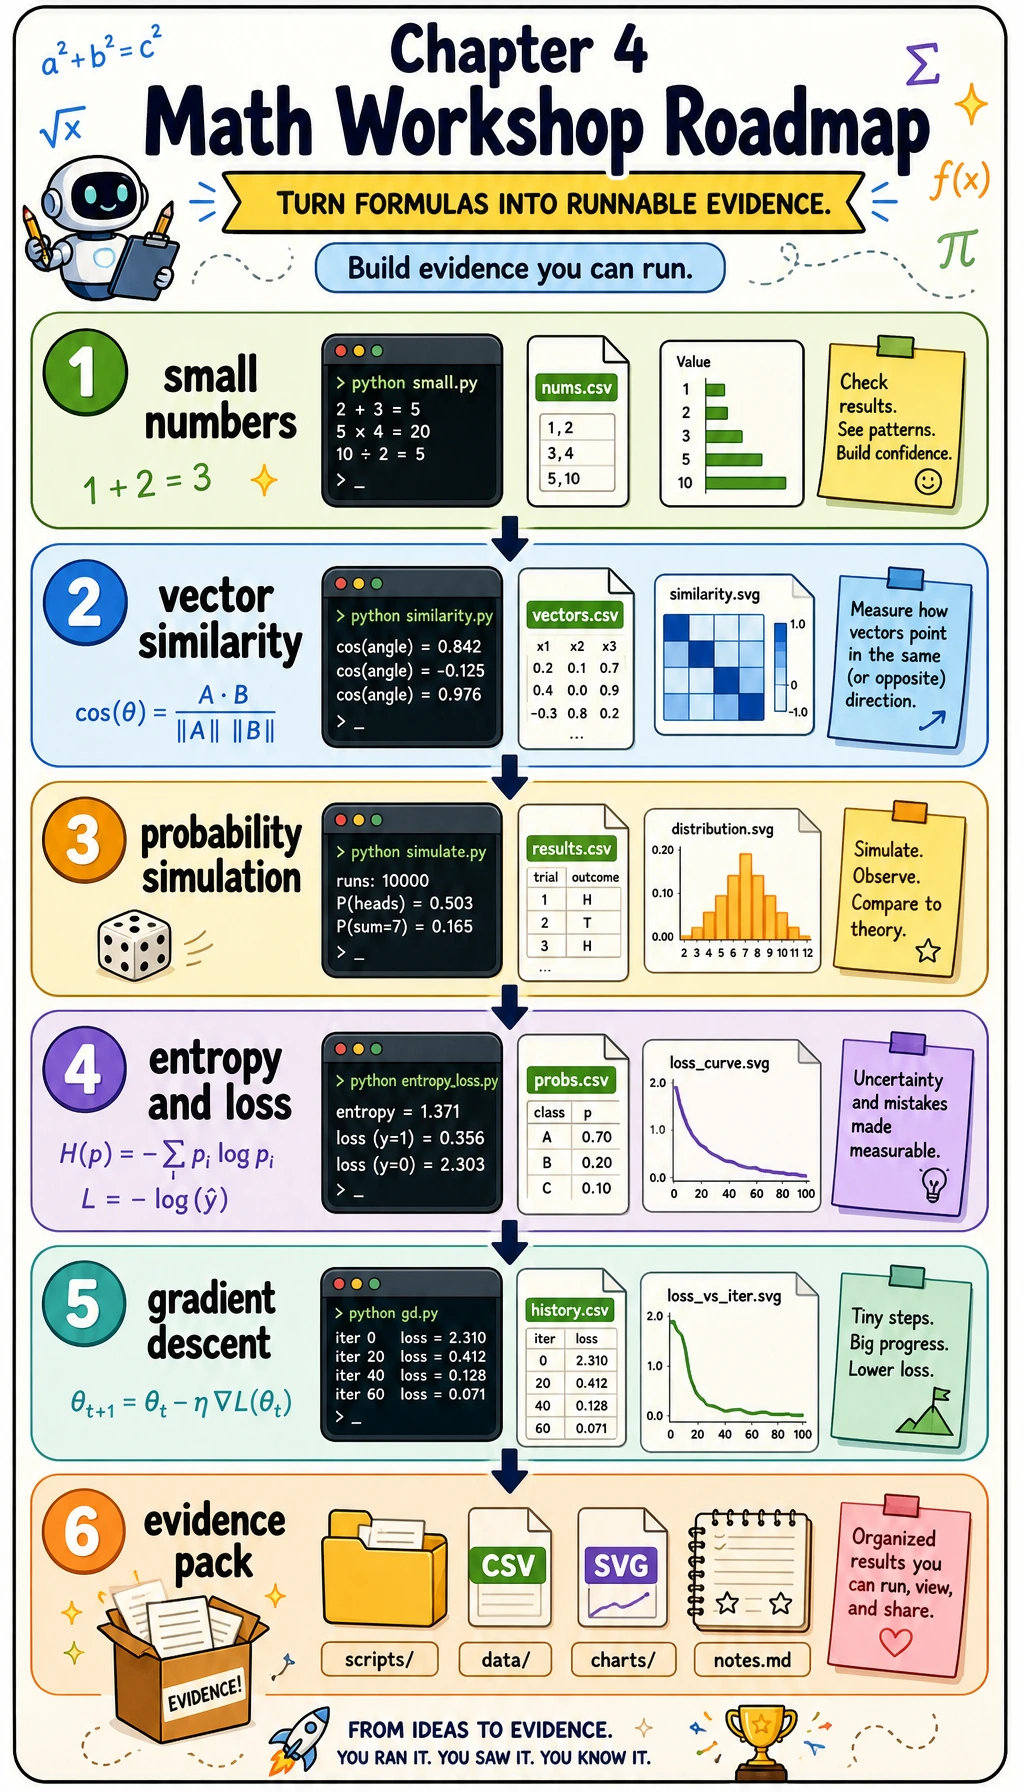
The whole route is: small numbers first, then code, then visible evidence.
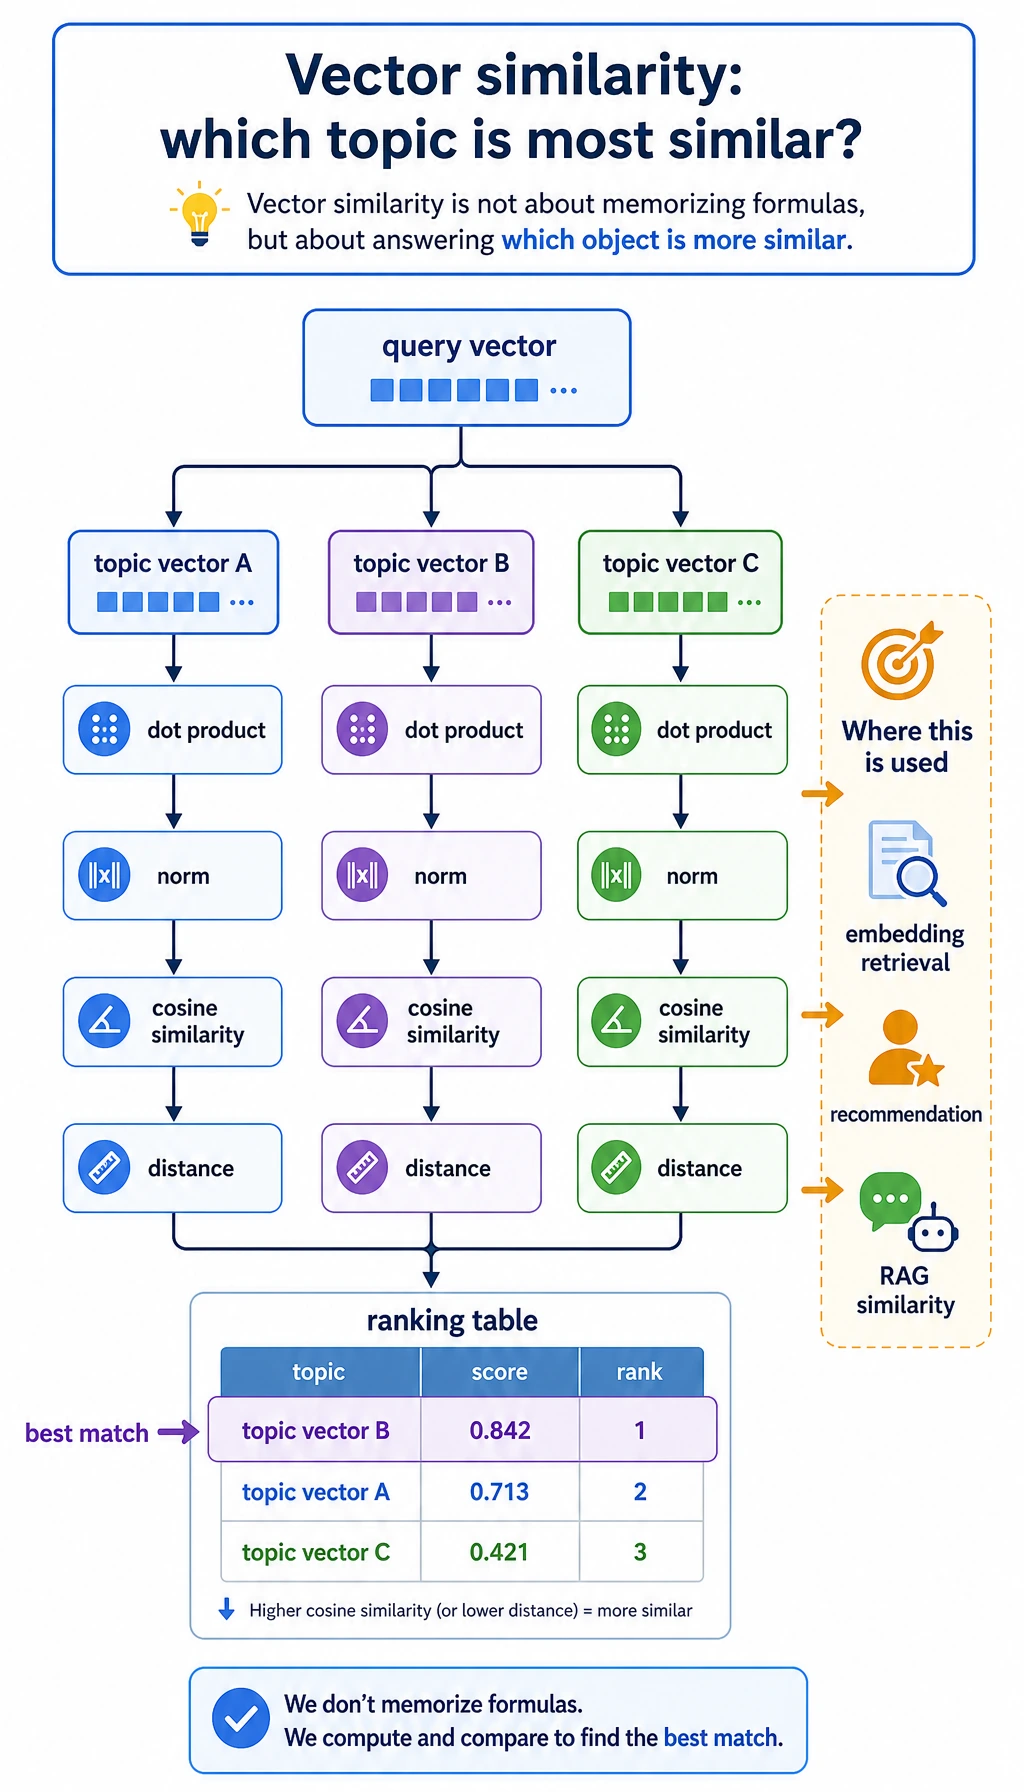
The vector step answers one question: which topic vector points most like the query vector?
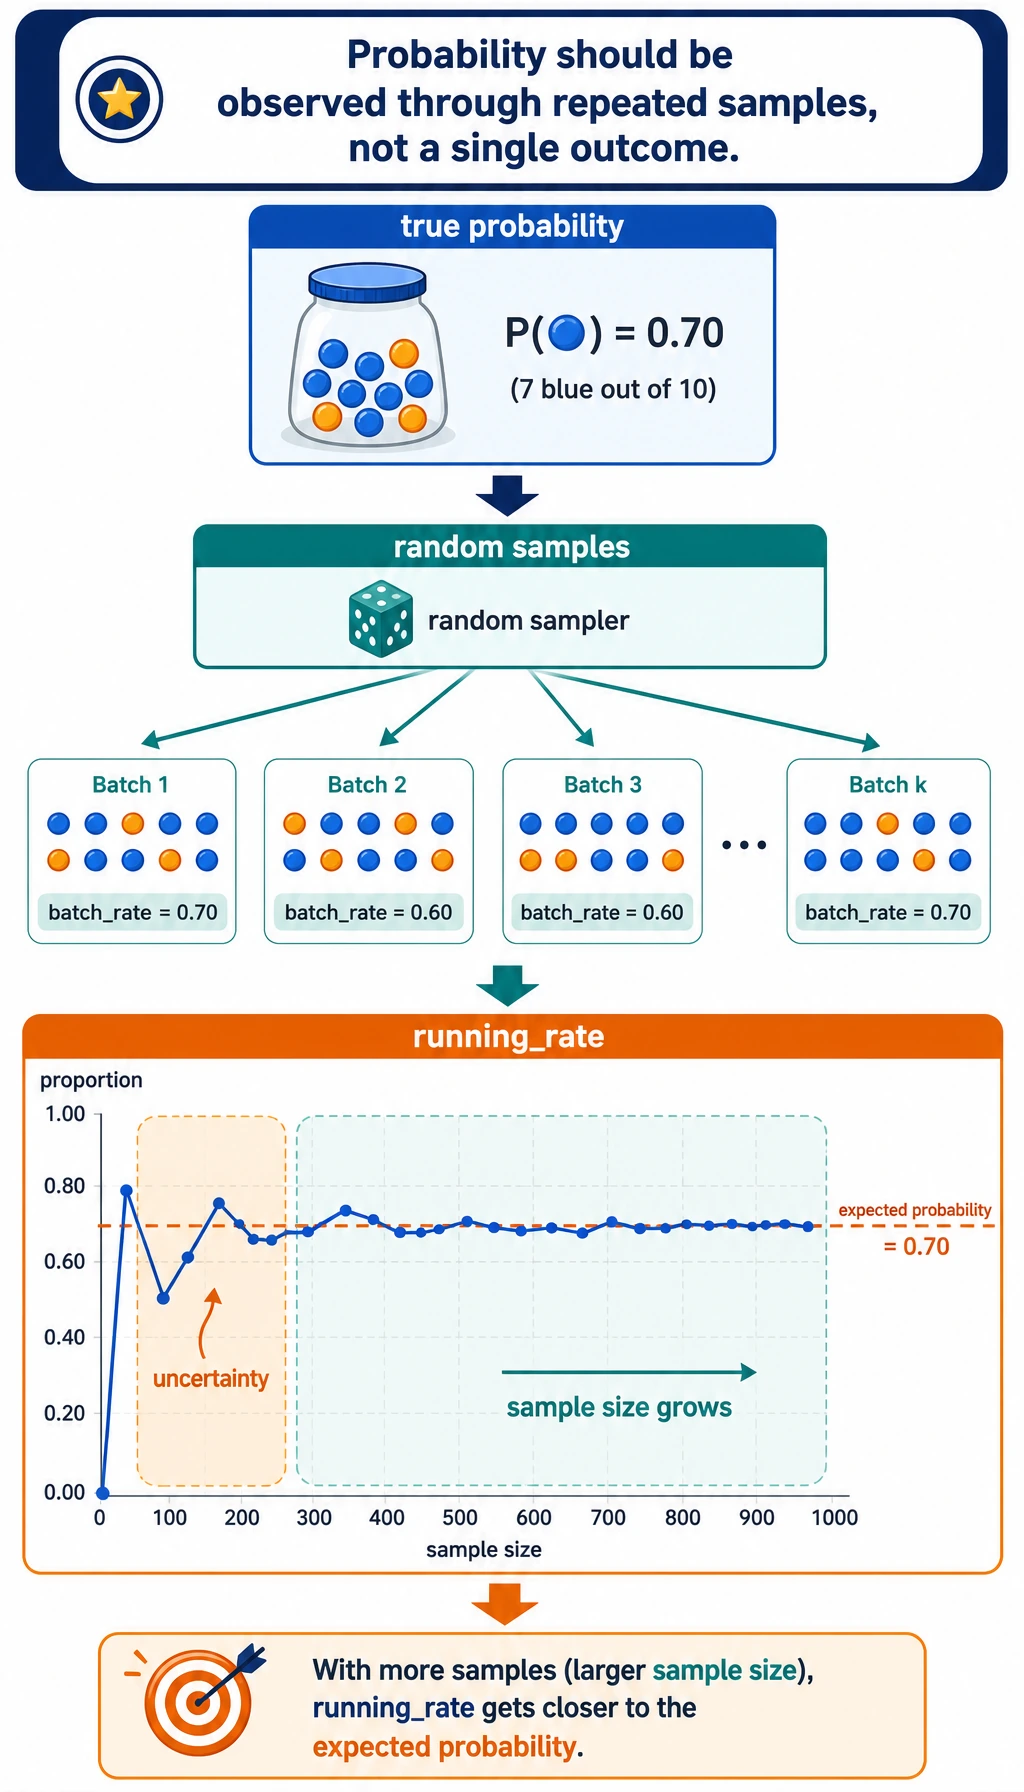
The probability step shows why a model score is not a single magical truth; it is a way to summarize uncertainty across samples.
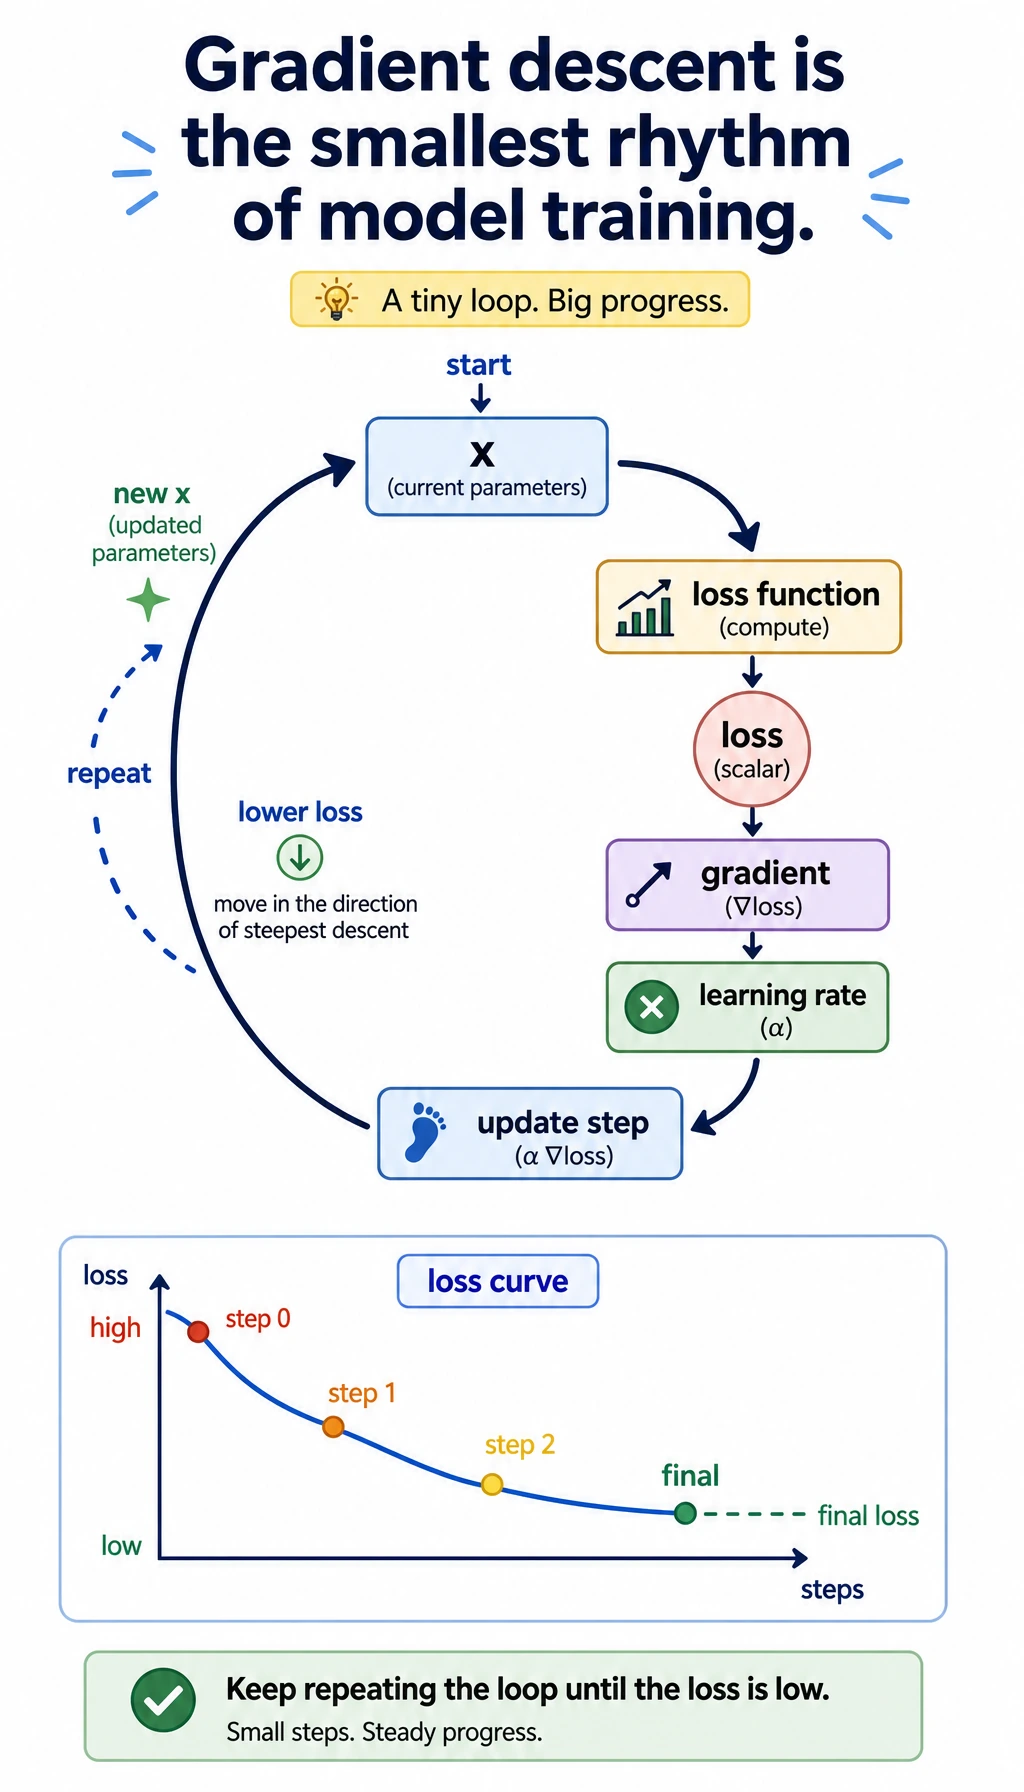
The gradient descent step shows the training rhythm: compute loss, compute slope, update the parameter, repeat.
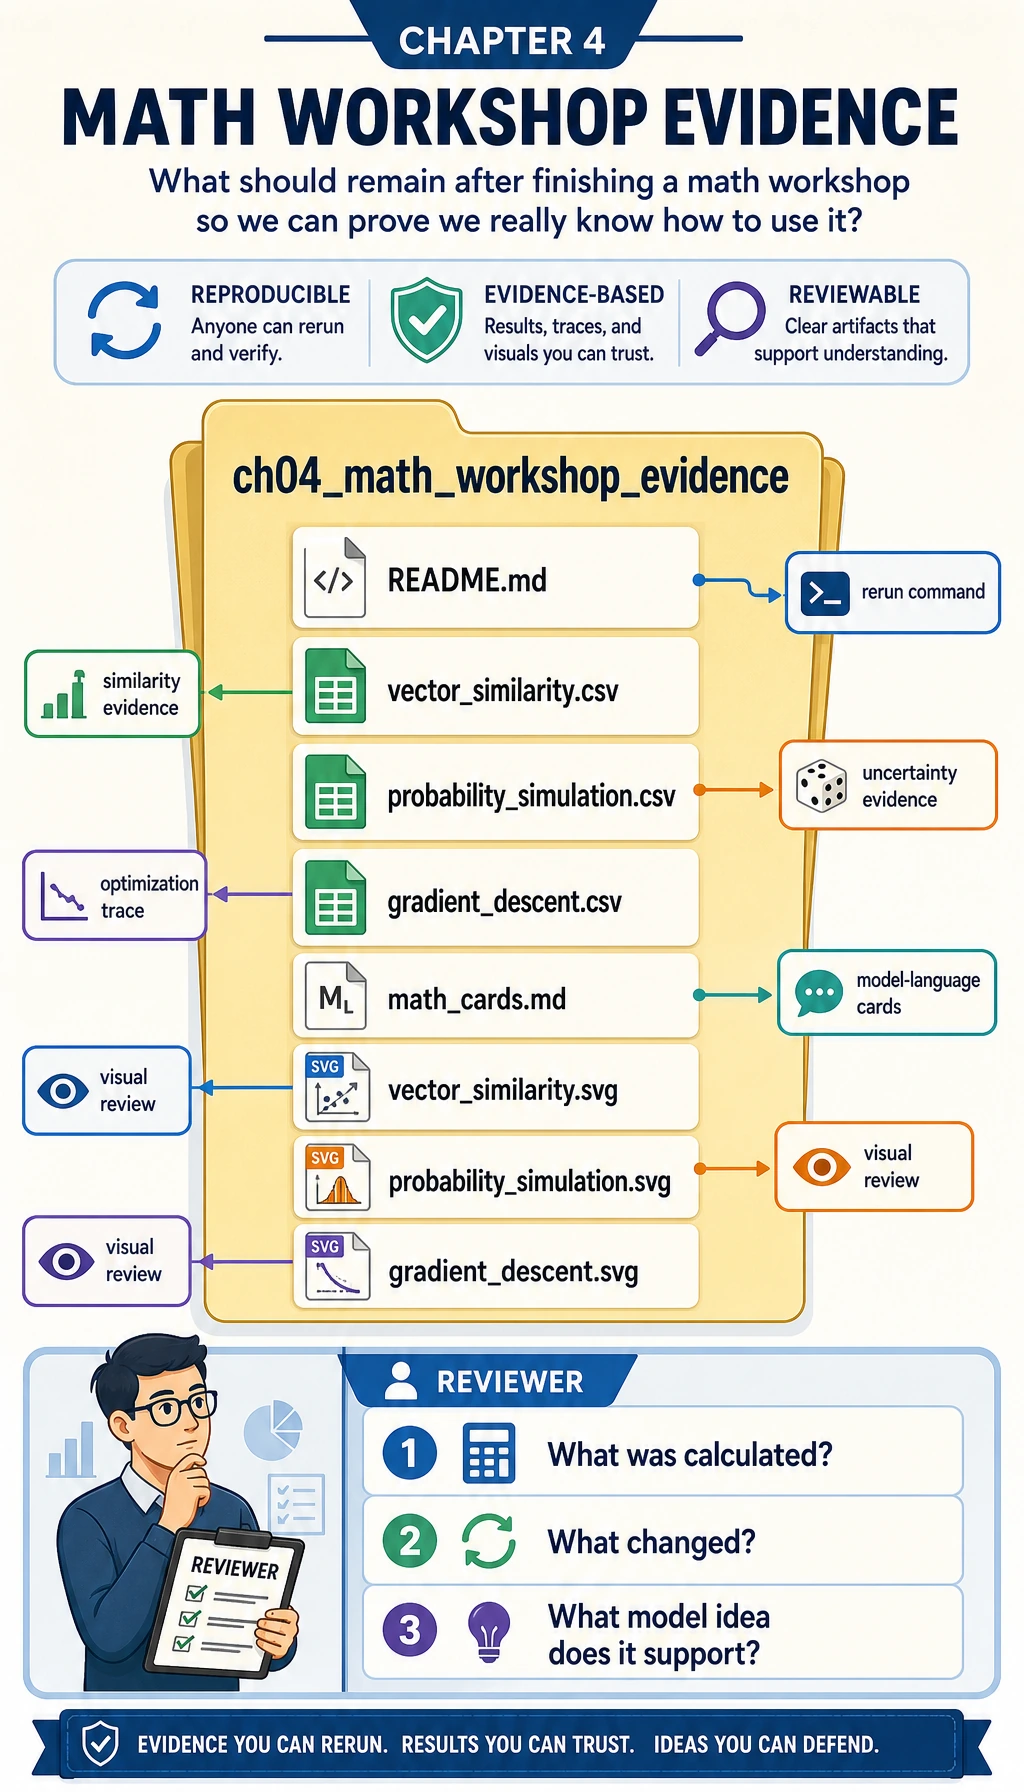
The evidence folder is the final learning artifact. It lets you review the math without rerunning everything from memory.
Create the Project Folder
Create a small local folder:
mkdir ch04_math_hands_on
cd ch04_math_hands_on
Then create a file named math_workshop.py.
Paste and Run the Workshop Code
Save the following code into math_workshop.py:
import csv
import math
import random
from pathlib import Path


OUT_DIR = Path("ch04_math_workshop_evidence")

QUERY = ("ai_math_foundation", [1.0, 0.7, 0.2])
TOPICS = [
    ("vector_similarity", [1.0, 0.8, 0.1], "Embedding and retrieval need similarity."),
    ("probability", [0.2, 1.0, 0.7], "Classification confidence needs uncertainty."),
    ("gradient_descent", [0.8, 0.2, 1.0], "Training needs a direction of improvement."),
]


def dot(a, b):
    return sum(x * y for x, y in zip(a, b))


def norm(v):
    return math.sqrt(sum(x * x for x in v))


def cosine_similarity(a, b):
    return dot(a, b) / (norm(a) * norm(b))


def euclidean_distance(a, b):
    return math.sqrt(sum((x - y) ** 2 for x, y in zip(a, b)))


def run_vector_similarity():
    query_name, query = QUERY
    rows = []
    for topic, vector, note in TOPICS:
        rows.append(
            {
                "query": query_name,
                "topic": topic,
                "dot": round(dot(query, vector), 4),
                "query_norm": round(norm(query), 4),
                "topic_norm": round(norm(vector), 4),
                "cosine_similarity": round(cosine_similarity(query, vector), 4),
                "euclidean_distance": round(euclidean_distance(query, vector), 4),
                "model_language": note,
            }
        )
    return sorted(rows, key=lambda row: row["cosine_similarity"], reverse=True)


def run_probability_simulation(seed=42, batches=12, trials_per_batch=20, true_probability=0.65):
    random.seed(seed)
    rows = []
    running_successes = 0
    running_trials = 0
    for batch in range(1, batches + 1):
        successes = sum(1 for _ in range(trials_per_batch) if random.random() < true_probability)
        running_successes += successes
        running_trials += trials_per_batch
        rows.append(
            {
                "batch": batch,
                "batch_trials": trials_per_batch,
                "batch_successes": successes,
                "batch_rate": round(successes / trials_per_batch, 4),
                "running_rate": round(running_successes / running_trials, 4),
                "expected_probability": true_probability,
            }
        )
    return rows


def entropy(probabilities):
    return -sum(p * math.log2(p) for p in probabilities if p > 0)


def binary_cross_entropy(predicted_probability, actual_label):
    p = min(max(predicted_probability, 1e-9), 1 - 1e-9)
    return -(actual_label * math.log(p) + (1 - actual_label) * math.log(1 - p))


def run_information_examples():
    confident = [0.9, 0.1]
    uncertain = [0.5, 0.5]
    return {
        "entropy_confident_bits": round(entropy(confident), 4),
        "entropy_uncertain_bits": round(entropy(uncertain), 4),
        "loss_good_prediction": round(binary_cross_entropy(0.9, 1), 4),
        "loss_bad_prediction": round(binary_cross_entropy(0.2, 1), 4),
    }


def run_gradient_descent(start=3.5, learning_rate=0.2, steps=12):
    def loss(x):
        return (x - 1.4) ** 2 + 0.6

    def gradient(x):
        return 2 * (x - 1.4)

    x = start
    rows = []
    for step in range(steps + 1):
        current_loss = loss(x)
        current_gradient = gradient(x)
        rows.append(
            {
                "step": step,
                "x": round(x, 6),
                "loss": round(current_loss, 6),
                "gradient": round(current_gradient, 6),
                "learning_rate": learning_rate,
            }
        )
        x = x - learning_rate * current_gradient
    return rows


def write_csv(path, rows, fieldnames):
    with path.open("w", newline="", encoding="utf-8") as file:
        writer = csv.DictWriter(file, fieldnames=fieldnames)
        writer.writeheader()
        writer.writerows(rows)


def scale(value, old_min, old_max, new_min, new_max):
    if old_max == old_min:
        return (new_min + new_max) / 2
    ratio = (value - old_min) / (old_max - old_min)
    return new_min + ratio * (new_max - new_min)


def write_vector_svg(path, rows):
    width, height = 640, 420
    bars = []
    for index, row in enumerate(rows):
        bar_width = int(row["cosine_similarity"] * 360)
        y = 80 + index * 90
        bars.append(
            f'<text x="40" y="{y}" font-size="18">{row["topic"]}</text>'
            f'<rect x="240" y="{y - 22}" width="{bar_width}" height="28" fill="#4f8cff" />'
            f'<text x="{250 + bar_width}" y="{y}" font-size="16">{row["cosine_similarity"]}</text>'
        )
    svg = f'''<svg xmlns="http://www.w3.org/2000/svg" width="{width}" height="{height}" viewBox="0 0 {width} {height}">
<rect width="100%" height="100%" fill="#ffffff"/>
<text x="40" y="40" font-size="24" font-family="Arial">Vector similarity by cosine</text>
{''.join(bars)}
</svg>'''
    path.write_text(svg, encoding="utf-8")


def write_probability_svg(path, rows):
    width, height = 700, 420
    points = []
    for row in rows:
        x = scale(row["batch"], 1, len(rows), 70, 640)
        y = scale(row["running_rate"], 0.4, 0.9, 330, 80)
        points.append((x, y))
    polyline = " ".join(f"{x:.1f},{y:.1f}" for x, y in points)
    expected_y = scale(rows[0]["expected_probability"], 0.4, 0.9, 330, 80)
    circles = "".join(f'<circle cx="{x:.1f}" cy="{y:.1f}" r="5" fill="#f26d3d"/>' for x, y in points)
    svg = f'''<svg xmlns="http://www.w3.org/2000/svg" width="{width}" height="{height}" viewBox="0 0 {width} {height}">
<rect width="100%" height="100%" fill="#ffffff"/>
<text x="40" y="40" font-size="24" font-family="Arial">Running probability estimate</text>
<line x1="70" y1="{expected_y:.1f}" x2="640" y2="{expected_y:.1f}" stroke="#888" stroke-dasharray="8 6"/>
<text x="70" y="{expected_y - 10:.1f}" font-size="14">expected p=0.65</text>
<polyline points="{polyline}" fill="none" stroke="#f26d3d" stroke-width="3"/>
{circles}
</svg>'''
    path.write_text(svg, encoding="utf-8")


def write_gradient_svg(path, rows):
    width, height = 700, 420
    losses = [row["loss"] for row in rows]
    points = []
    for row in rows:
        x = scale(row["step"], 0, rows[-1]["step"], 70, 640)
        y = scale(row["loss"], min(losses), max(losses), 330, 80)
        points.append((x, y))
    polyline = " ".join(f"{x:.1f},{y:.1f}" for x, y in points)
    circles = "".join(f'<circle cx="{x:.1f}" cy="{y:.1f}" r="5" fill="#2f9e44"/>' for x, y in points)
    svg = f'''<svg xmlns="http://www.w3.org/2000/svg" width="{width}" height="{height}" viewBox="0 0 {width} {height}">
<rect width="100%" height="100%" fill="#ffffff"/>
<text x="40" y="40" font-size="24" font-family="Arial">Gradient descent lowers loss</text>
<polyline points="{polyline}" fill="none" stroke="#2f9e44" stroke-width="3"/>
{circles}
</svg>'''
    path.write_text(svg, encoding="utf-8")


def write_math_cards(path, info_examples):
    content = f"""# Math Cards

## Vector

Model language: a vector is a small numeric description of an object.
Workshop evidence: `vector_similarity.csv` shows which topic vector is closest to the query.

## Probability

Model language: probability is a controlled way to talk about uncertainty.
Workshop evidence: `probability_simulation.csv` shows observed rates moving around the expected rate.

## Entropy and Loss

Model language: entropy measures uncertainty; loss measures how painful a prediction mistake is.
Confident entropy: {info_examples['entropy_confident_bits']} bits.
Uncertain entropy: {info_examples['entropy_uncertain_bits']} bits.
Good prediction loss: {info_examples['loss_good_prediction']}.
Bad prediction loss: {info_examples['loss_bad_prediction']}.

## Gradient

Model language: a gradient tells a parameter which direction changes the loss fastest.
Workshop evidence: `gradient_descent.csv` shows x moving toward the low-loss point.
"""
    path.write_text(content, encoding="utf-8")


def write_readme(path, best_topic, final_gradient_row):
    content = f"""# Chapter 4 Math Workshop Evidence

Run command: `python math_workshop.py`

Best vector match: `{best_topic}`.
Final gradient descent point: x={final_gradient_row['x']}, loss={final_gradient_row['loss']}.

Review order:

1. Open `vector_similarity.csv`.
2. Open `probability_simulation.csv`.
3. Open `gradient_descent.csv`.
4. Read `math_cards.md`.
5. Inspect the SVG files.
"""
    path.write_text(content, encoding="utf-8")


def main():
    OUT_DIR.mkdir(exist_ok=True)

    vector_rows = run_vector_similarity()
    probability_rows = run_probability_simulation()
    info_examples = run_information_examples()
    gradient_rows = run_gradient_descent()

    write_csv(
        OUT_DIR / "vector_similarity.csv",
        vector_rows,
        ["query", "topic", "dot", "query_norm", "topic_norm", "cosine_similarity", "euclidean_distance", "model_language"],
    )
    write_csv(
        OUT_DIR / "probability_simulation.csv",
        probability_rows,
        ["batch", "batch_trials", "batch_successes", "batch_rate", "running_rate", "expected_probability"],
    )
    write_csv(
        OUT_DIR / "gradient_descent.csv",
        gradient_rows,
        ["step", "x", "loss", "gradient", "learning_rate"],
    )

    write_vector_svg(OUT_DIR / "vector_similarity.svg", vector_rows)
    write_probability_svg(OUT_DIR / "probability_simulation.svg", probability_rows)
    write_gradient_svg(OUT_DIR / "gradient_descent.svg", gradient_rows)
    write_math_cards(OUT_DIR / "math_cards.md", info_examples)
    write_readme(OUT_DIR / "README.md", vector_rows[0]["topic"], gradient_rows[-1])

    print("STEP 1: Vector similarity")
    print(f"best_match={vector_rows[0]['topic']} cosine={vector_rows[0]['cosine_similarity']}")

    print("\nSTEP 2: Probability simulation")
    print(f"final_running_rate={probability_rows[-1]['running_rate']} expected={probability_rows[-1]['expected_probability']}")

    print("\nSTEP 3: Entropy and loss")
    print(f"confident_entropy={info_examples['entropy_confident_bits']} uncertain_entropy={info_examples['entropy_uncertain_bits']}")
    print(f"good_loss={info_examples['loss_good_prediction']} bad_loss={info_examples['loss_bad_prediction']}")

    print("\nSTEP 4: Gradient descent")
    print(f"start_loss={gradient_rows[0]['loss']} final_x={gradient_rows[-1]['x']} final_loss={gradient_rows[-1]['loss']}")

    print("\nSTEP 5: Evidence files")
    for name in [
        "README.md",
        "vector_similarity.csv",
        "probability_simulation.csv",
        "gradient_descent.csv",
        "math_cards.md",
        "vector_similarity.svg",
        "probability_simulation.svg",
        "gradient_descent.svg",
    ]:
        print((OUT_DIR / name).as_posix())


if __name__ == "__main__":
    main()
Run it:
python math_workshop.py
If your system uses python3, run:
python3 math_workshop.py
Expected Output
You should see output close to this:
STEP 1: Vector similarity
best_match=vector_similarity cosine=0.9944

STEP 2: Probability simulation
final_running_rate=0.6833 expected=0.65

STEP 3: Entropy and loss
confident_entropy=0.469 uncertain_entropy=1.0
good_loss=0.1054 bad_loss=1.6094

STEP 4: Gradient descent
start_loss=5.01 final_x=1.404571 final_loss=0.600021

STEP 5: Evidence files
ch04_math_workshop_evidence/README.md
ch04_math_workshop_evidence/vector_similarity.csv
ch04_math_workshop_evidence/probability_simulation.csv
ch04_math_workshop_evidence/gradient_descent.csv
ch04_math_workshop_evidence/math_cards.md
ch04_math_workshop_evidence/vector_similarity.svg
ch04_math_workshop_evidence/probability_simulation.svg
ch04_math_workshop_evidence/gradient_descent.svg
Small differences are fine if you change the seed, learning rate, or number of steps.
How to Read the Files
Open vector_similarity.csv first. Do not only look at the highest score. Compare dot, cosine_similarity, and euclidean_distance. The important habit is to connect the metric to the question: do you care about same direction, same size, or both?
Open probability_simulation.csv next. Look at batch_rate and running_rate. A single batch can jump around, but the running rate becomes more stable. This is why evaluation sets, sample size, and confidence matter in model work.
Open gradient_descent.csv last. Follow x, loss, and gradient. The gradient starts large, then becomes smaller as x approaches the low-loss point. This is the small-number version of model training.
Translate Concepts into Model Language
| Concept | In formulas | In model language | Workshop file |
|---|---|---|---|
| Vector | A list of numbers | A compact description of an object | vector_similarity.csv |
| Dot product | Sum of matched components | How strongly two directions agree | vector_similarity.csv |
| Cosine similarity | Dot product divided by lengths | Similarity after removing length effects | vector_similarity.csv |
| Probability | Number from 0 to 1 | How uncertain or likely an event is | probability_simulation.csv |
| Entropy | Expected surprise | How uncertain a distribution is | math_cards.md |
| Cross-entropy loss | Penalty for wrong confidence | How painful a prediction mistake is | math_cards.md |
| Gradient | Direction of fastest change | How a parameter should move | gradient_descent.csv |
Beginner Troubleshooting
| Symptom | Likely cause | Fix |
|---|---|---|
python: command not found | Your system uses python3 | Run python3 math_workshop.py |
| The SVG file opens as text | Your editor opened the source XML | Open it in a browser instead |
| Probability output is slightly different | You changed the random seed or trial count | Keep seed=42 for the documented result |
| Gradient descent jumps too much | Learning rate is too large | Try learning_rate=0.05 |
| Gradient descent moves too slowly | Learning rate is too small | Try learning_rate=0.3 only after seeing the stable version |
| The numbers feel meaningless | You are reading them without a model question | Ask: similarity, uncertainty, or update direction? |
Guided Exercises
- Change
QUERYto[0.1, 1.0, 0.7]. Which topic becomes most similar? Why? - Change
true_probabilityfrom0.65to0.5. What happens to the running rate? - Change
learning_ratefrom0.2to0.05. Does the loss still fall? Is it faster or slower? - Add one new section to
math_cards.mdexplaining matrix multiplication in your own words. - Write one sentence connecting each file to a later chapter: machine learning, deep learning, RAG, or LLM.
Exit Checklist
- I can run the workshop locally.
- I can explain why vector similarity can support retrieval or recommendation.
- I can explain why probability needs repeated samples and not one lucky run.
- I can explain why entropy is larger for uncertain distributions.
- I can explain why gradient descent updates a parameter in small steps.
- I saved the evidence folder and can explain what each file proves.
If you can check all six items, Chapter 4 is no longer just a formula chapter. It has become a runnable model-intuition toolkit.