3.6.3 Follow-Along Workshop: Build a Reproducible Data Analysis Pipeline
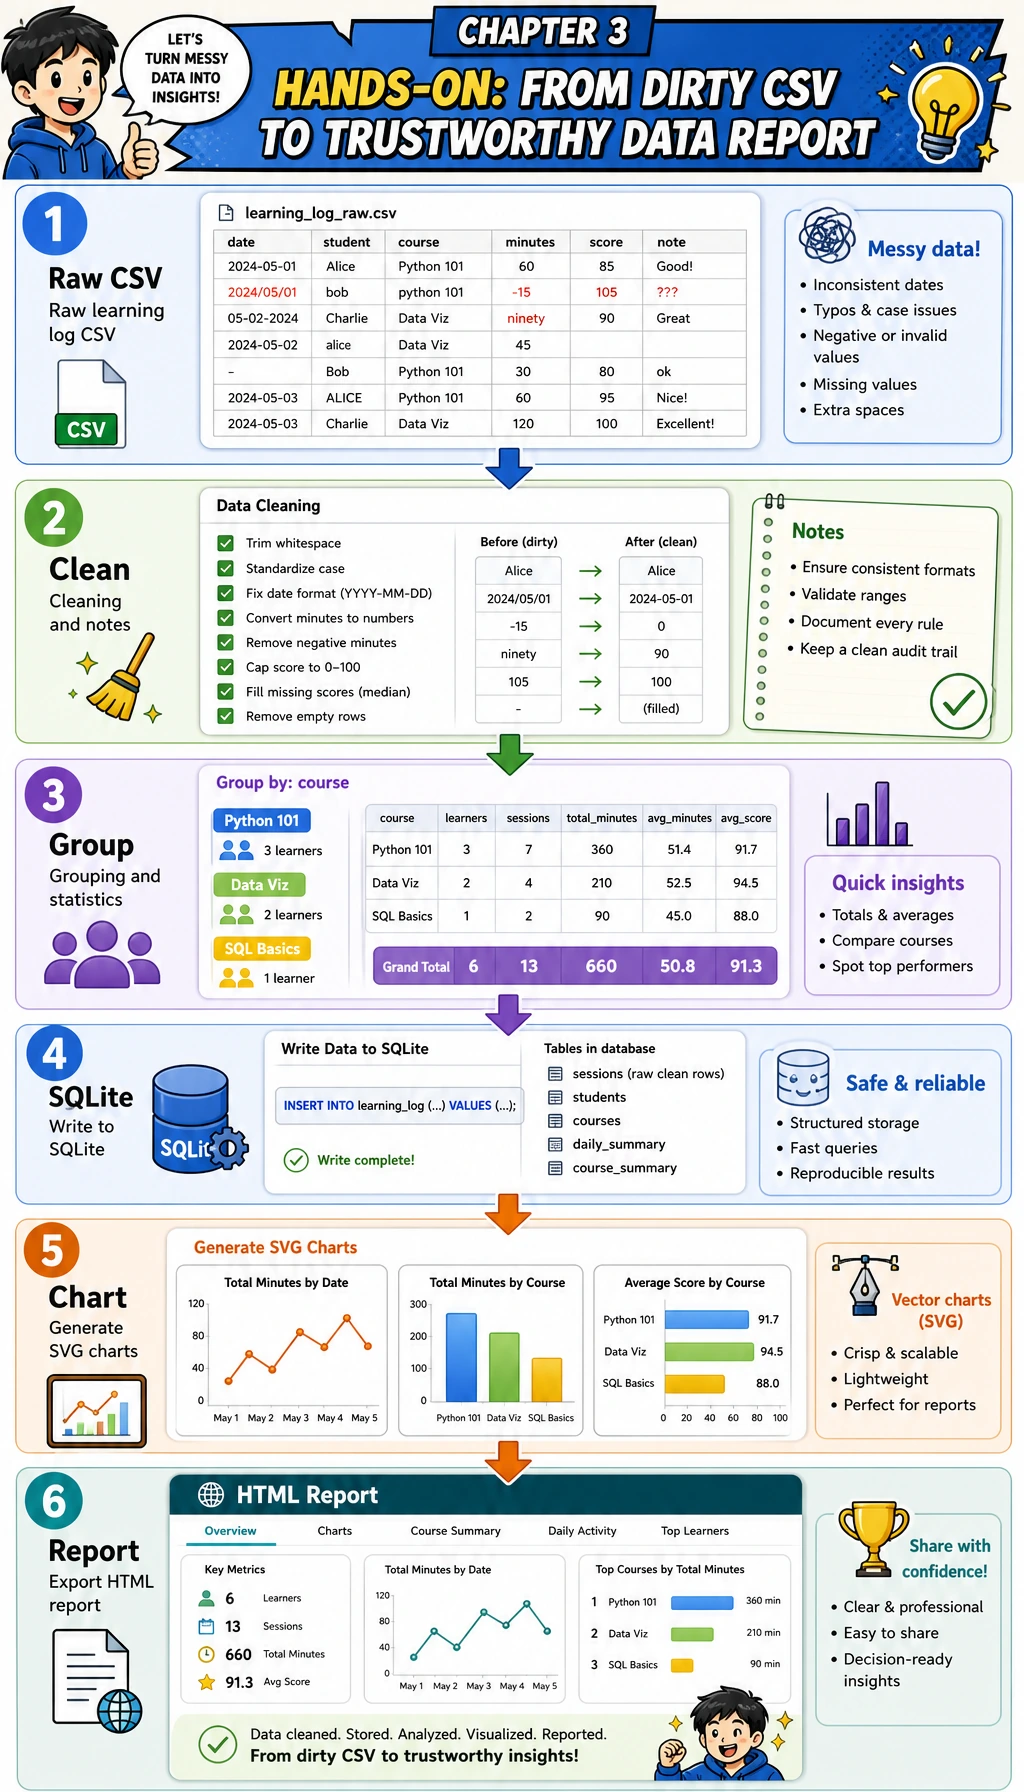
This page is the hands-on bridge for Chapter 3. Instead of learning NumPy, Pandas, visualization, and SQL as isolated topics, you will complete one runnable flow: dirty CSV → clean table → grouped statistics → SQLite query → chart → report evidence.
What you will build
You will create a small learning-log analysis pipeline. It does not need external packages, so it works with the Python standard library on a fresh machine. That makes the workflow easy to run first; later you can upgrade the same steps to Pandas, Matplotlib, or a Notebook.
By the end, your folder will contain:
| File | Meaning |
|---|---|
raw_learning_log.csv | The intentionally dirty input data |
clean_learning_log.csv | The cleaned table used for analysis |
cleaning_log.json | A record of every dropped row and the reason |
learning_log.sqlite3 | A SQLite database created from the cleaned rows |
topic_minutes.svg | A chart generated by the script |
report.html | A simple analysis report you can open in a browser |
Step 0: Create a clean practice folder
Run these commands in a terminal. If you are on Windows, use PowerShell and replace python3 with python if needed.
mkdir ch03-learning-log-workshop
cd ch03-learning-log-workshop
python3 --version
Expected output will look similar to this. The exact version number can be different.
Python 3.12.3
Keep this terminal open. All following commands assume you are inside ch03-learning-log-workshop.
Step 1: Understand the pipeline before writing code
The key idea is simple: never jump from raw data to conclusions. A trustworthy analysis keeps evidence for each transformation.
| Stage | Question | Output |
|---|---|---|
| Generate input | What does the raw data look like? | raw_learning_log.csv |
| Clean | Which rows are invalid or duplicated? | clean_learning_log.csv, cleaning_log.json |
| Summarize | Which topic took the most time? | grouped topic statistics |
| Query | Can the same clean data be queried like a database? | learning_log.sqlite3 |
| Visualize | Which result should be seen at a glance? | topic_minutes.svg |
| Report | What should another person believe and verify? | report.html |
Step 2: Create the runnable script
Create a file named learning_log_pipeline.py, then paste the full script below.
from __future__ import annotations

import csv
import html
import json
import sqlite3
from collections import defaultdict
from pathlib import Path
from statistics import mean

OUTPUT_DIR = Path("ch03_output")
RAW_CSV = OUTPUT_DIR / "raw_learning_log.csv"
CLEAN_CSV = OUTPUT_DIR / "clean_learning_log.csv"
DATABASE = OUTPUT_DIR / "learning_log.sqlite3"
CHART_SVG = OUTPUT_DIR / "topic_minutes.svg"
REPORT_HTML = OUTPUT_DIR / "report.html"
CLEANING_LOG = OUTPUT_DIR / "cleaning_log.json"

FIELDNAMES = ["date", "topic", "minutes", "status", "confidence", "note"]

RAW_ROWS = [
    {"date": "2026-05-01", "topic": "Python", "minutes": "45", "status": "completed", "confidence": "0.92", "note": "loops and conditions"},
    {"date": "2026-05-01", "topic": " pandas ", "minutes": "30", "status": "stuck", "confidence": "0.55", "note": "merge confusion"},
    {"date": "2026-05-02", "topic": "Python", "minutes": "60", "status": "completed", "confidence": "0.88", "note": "functions"},
    {"date": "2026-05-02", "topic": "SQL", "minutes": "35", "status": "completed", "confidence": "0.81", "note": "select and where"},
    {"date": "2026-05-03", "topic": "Pandas", "minutes": "", "status": "stuck", "confidence": "0.40", "note": "forgot to track time"},
    {"date": "2026-05-03", "topic": "Visualization", "minutes": "50", "status": "completed", "confidence": "0.76", "note": "bar chart"},
    {"date": "2026-05-04", "topic": "sql", "minutes": "-10", "status": "completed", "confidence": "0.70", "note": "timer entered backwards"},
    {"date": "2026-05-04", "topic": "Pandas", "minutes": "40", "status": "completed", "confidence": "0.66", "note": "groupby practice"},
    {"date": "2026-05-05", "topic": "Python", "minutes": "45", "status": "completed", "confidence": "0.82", "note": "list comprehension"},
    {"date": "2026-05-05", "topic": "Python", "minutes": "45", "status": "completed", "confidence": "0.82", "note": "list comprehension"},
    {"date": "2026-05-05", "topic": "RAG", "minutes": "25", "status": "stuck", "confidence": "0.50", "note": "chunking terms"},
    {"date": "2026-05-06", "topic": "Visualization", "minutes": "65", "status": "completed", "confidence": "0.91", "note": "line chart"},
]


def normalize_topic(value: str) -> str:
    aliases = {
        "python": "Python",
        "pandas": "Pandas",
        "sql": "SQL",
        "visualization": "Visualization",
        "rag": "RAG",
    }
    cleaned = value.strip().lower()
    return aliases.get(cleaned, cleaned.title())


def parse_positive_minutes(value: str) -> int | None:
    try:
        minutes = int(value)
    except (TypeError, ValueError):
        return None
    if minutes <= 0:
        return None
    return minutes


def parse_confidence(value: str) -> float:
    try:
        confidence = float(value)
    except (TypeError, ValueError):
        return 0.0
    return max(0.0, min(confidence, 1.0))


def write_raw_csv() -> None:
    OUTPUT_DIR.mkdir(exist_ok=True)
    with RAW_CSV.open("w", encoding="utf-8", newline="") as file:
        writer = csv.DictWriter(file, fieldnames=FIELDNAMES)
        writer.writeheader()
        writer.writerows(RAW_ROWS)


def load_and_clean(path: Path) -> tuple[list[dict[str, object]], list[dict[str, object]]]:
    clean_rows: list[dict[str, object]] = []
    cleaning_log: list[dict[str, object]] = []
    seen: set[tuple[object, ...]] = set()

    with path.open(encoding="utf-8", newline="") as file:
        reader = csv.DictReader(file)
        for line_number, row in enumerate(reader, start=2):
            topic = normalize_topic(row["topic"])
            status = row["status"].strip().lower()
            minutes = parse_positive_minutes(row["minutes"])
            confidence = parse_confidence(row["confidence"])
            note = row["note"].strip()

            if minutes is None:
                cleaning_log.append({"line": line_number, "action": "drop", "reason": "minutes is missing, non-numeric, or <= 0", "row": row})
                continue

            key = (row["date"].strip(), topic, minutes, status, note)
            if key in seen:
                cleaning_log.append({"line": line_number, "action": "drop", "reason": "duplicate learning record", "row": row})
                continue
            seen.add(key)

            clean_rows.append(
                {
                    "date": row["date"].strip(),
                    "topic": topic,
                    "minutes": minutes,
                    "status": status,
                    "confidence": confidence,
                    "note": note,
                }
            )

    return clean_rows, cleaning_log


def write_clean_csv(rows: list[dict[str, object]]) -> None:
    with CLEAN_CSV.open("w", encoding="utf-8", newline="") as file:
        writer = csv.DictWriter(file, fieldnames=FIELDNAMES)
        writer.writeheader()
        writer.writerows(rows)


def summarize_by_topic(rows: list[dict[str, object]]) -> list[dict[str, object]]:
    buckets: dict[str, dict[str, object]] = defaultdict(lambda: {"minutes": 0, "sessions": 0, "completed": 0, "confidence_values": []})
    for row in rows:
        topic = str(row["topic"])
        buckets[topic]["minutes"] = int(buckets[topic]["minutes"]) + int(row["minutes"])
        buckets[topic]["sessions"] = int(buckets[topic]["sessions"]) + 1
        buckets[topic]["completed"] = int(buckets[topic]["completed"]) + (1 if row["status"] == "completed" else 0)
        buckets[topic]["confidence_values"].append(float(row["confidence"]))

    summary = []
    for topic, values in buckets.items():
        sessions = int(values["sessions"])
        completed = int(values["completed"])
        confidence_values = values["confidence_values"]
        summary.append(
            {
                "topic": topic,
                "minutes": int(values["minutes"]),
                "sessions": sessions,
                "completion_rate": round(completed / sessions * 100, 1),
                "avg_confidence": round(mean(confidence_values), 2),
            }
        )
    return sorted(summary, key=lambda item: (-int(item["minutes"]), str(item["topic"])))


def write_cleaning_log(cleaning_log: list[dict[str, object]]) -> None:
    CLEANING_LOG.write_text(json.dumps(cleaning_log, ensure_ascii=False, indent=2), encoding="utf-8")


def write_sqlite(rows: list[dict[str, object]]) -> None:
    with sqlite3.connect(DATABASE) as conn:
        conn.execute("DROP TABLE IF EXISTS learning_logs")
        conn.execute(
            """
            CREATE TABLE learning_logs (
                date TEXT NOT NULL,
                topic TEXT NOT NULL,
                minutes INTEGER NOT NULL,
                status TEXT NOT NULL,
                confidence REAL NOT NULL,
                note TEXT NOT NULL
            )
            """
        )
        conn.executemany(
            """
            INSERT INTO learning_logs (date, topic, minutes, status, confidence, note)
            VALUES (:date, :topic, :minutes, :status, :confidence, :note)
            """,
            rows,
        )


def query_sqlite_top_topics() -> list[tuple[str, int, float]]:
    with sqlite3.connect(DATABASE) as conn:
        return conn.execute(
            """
            SELECT topic, SUM(minutes) AS total_minutes, ROUND(AVG(confidence), 2) AS avg_confidence
            FROM learning_logs
            GROUP BY topic
            ORDER BY total_minutes DESC
            LIMIT 3
            """
        ).fetchall()


def write_svg_bar_chart(summary: list[dict[str, object]]) -> None:
    max_minutes = max(int(item["minutes"]) for item in summary)
    width = 860
    height = 120 + len(summary) * 74
    left = 180
    bar_max_width = 540
    colors = ["#2563eb", "#0f766e", "#dc2626", "#7c3aed", "#ea580c"]
    lines = [
        f'<svg xmlns="http://www.w3.org/2000/svg" width="{width}" height="{height}" viewBox="0 0 {width} {height}">',
        '<rect width="100%" height="100%" fill="#f8fafc"/>',
        '<text x="32" y="48" font-family="Arial, sans-serif" font-size="26" font-weight="700" fill="#0f172a">Study minutes by topic</text>',
        '<text x="32" y="78" font-family="Arial, sans-serif" font-size="15" fill="#475569">Cleaned learning-log records, grouped by topic</text>',
    ]
    for index, item in enumerate(summary):
        y = 112 + index * 74
        topic = html.escape(str(item["topic"]))
        minutes = int(item["minutes"])
        bar_width = int(minutes / max_minutes * bar_max_width)
        color = colors[index % len(colors)]
        lines.extend(
            [
                f'<text x="32" y="{y + 27}" font-family="Arial, sans-serif" font-size="18" fill="#0f172a">{topic}</text>',
                f'<rect x="{left}" y="{y}" width="{bar_max_width}" height="34" rx="8" fill="#e2e8f0"/>',
                f'<rect x="{left}" y="{y}" width="{bar_width}" height="34" rx="8" fill="{color}"/>',
                f'<text x="{left + bar_max_width + 20}" y="{y + 24}" font-family="Arial, sans-serif" font-size="17" fill="#0f172a">{minutes} min</text>',
            ]
        )
    lines.append("</svg>")
    CHART_SVG.write_text("\n".join(lines), encoding="utf-8")


def write_report(summary: list[dict[str, object]], sql_rows: list[tuple[str, int, float]], cleaning_log: list[dict[str, object]]) -> None:
    total_minutes = sum(int(item["minutes"]) for item in summary)
    rows_html = "\n".join(
        f"<tr><td>{html.escape(str(item['topic']))}</td><td>{item['minutes']}</td><td>{item['sessions']}</td><td>{item['completion_rate']}%</td><td>{item['avg_confidence']}</td></tr>"
        for item in summary
    )
    sql_html = "\n".join(
        f"<li><strong>{html.escape(topic)}</strong>: {minutes} minutes, average confidence {confidence}</li>"
        for topic, minutes, confidence in sql_rows
    )
    REPORT_HTML.write_text(
        f"""
<!doctype html>
<html lang="en">
<head>
  <meta charset="utf-8" />
  <title>Learning Log Analysis Report</title>
  <style>
    body {{ font-family: Arial, sans-serif; max-width: 960px; margin: 32px auto; color: #0f172a; line-height: 1.6; }}
    .cards {{ display: grid; grid-template-columns: repeat(3, 1fr); gap: 12px; }}
    .card {{ background: #eef2ff; border-radius: 12px; padding: 16px; }}
    table {{ width: 100%; border-collapse: collapse; margin-top: 16px; }}
    th, td {{ border-bottom: 1px solid #cbd5e1; text-align: left; padding: 10px; }}
    img {{ max-width: 100%; border: 1px solid #e2e8f0; border-radius: 12px; }}
  </style>
</head>
<body>
  <h1>Learning Log Analysis Report</h1>
  <p>This report was generated from a dirty CSV, then cleaned, summarized, queried with SQLite, and visualized.</p>
  <section class="cards">
    <div class="card"><strong>Total minutes</strong><br>{total_minutes}</div>
    <div class="card"><strong>Clean topics</strong><br>{len(summary)}</div>
    <div class="card"><strong>Dropped rows</strong><br>{len(cleaning_log)}</div>
  </section>
  <h2>Chart</h2>
  <img src="topic_minutes.svg" alt="Study minutes by topic" />
  <h2>Topic Summary</h2>
  <table>
    <tr><th>Topic</th><th>Minutes</th><th>Sessions</th><th>Completion rate</th><th>Avg confidence</th></tr>
    {rows_html}
  </table>
  <h2>SQLite top topics</h2>
  <ul>{sql_html}</ul>
  <h2>Conclusion</h2>
  <p>Python has the highest total study time. Visualization is also strong, but Pandas has lower confidence, so the next practice should focus on Pandas grouping and merging.</p>
</body>
</html>
""".strip(),
        encoding="utf-8",
    )


def main() -> None:
    write_raw_csv()
    clean_rows, cleaning_log = load_and_clean(RAW_CSV)
    summary = summarize_by_topic(clean_rows)
    write_clean_csv(clean_rows)
    write_cleaning_log(cleaning_log)
    write_sqlite(clean_rows)
    sql_rows = query_sqlite_top_topics()
    write_svg_bar_chart(summary)
    write_report(summary, sql_rows, cleaning_log)

    total_minutes = sum(int(row["minutes"]) for row in clean_rows)
    completed_rows = sum(1 for row in clean_rows if row["status"] == "completed")
    completion_rate = completed_rows / len(clean_rows) * 100
    top_topic = summary[0]

    print(f"Raw rows: {len(RAW_ROWS)}")
    print(f"Clean rows: {len(clean_rows)}")
    print(f"Dropped rows: {len(cleaning_log)}")
    print(f"Total study minutes: {total_minutes}")
    print(f"Completion rate: {completion_rate:.1f}%")
    print(f"Top topic: {top_topic['topic']} ({top_topic['minutes']} min)")
    print("\nTop 3 topics from SQLite:")
    for topic, minutes, confidence in sql_rows:
        print(f"- {topic}: {minutes} min, avg confidence {confidence}")
    print("\nGenerated files:")
    for path in [RAW_CSV, CLEAN_CSV, CLEANING_LOG, DATABASE, CHART_SVG, REPORT_HTML]:
        print(f"- {path.as_posix()}")


if __name__ == "__main__":
    main()
Step 3: Run it and compare the output
python3 learning_log_pipeline.py
Expected output:
Raw rows: 12
Clean rows: 9
Dropped rows: 3
Total study minutes: 395
Completion rate: 77.8%
Top topic: Python (150 min)

Top 3 topics from SQLite:
- Python: 150 min, avg confidence 0.87
- Visualization: 115 min, avg confidence 0.83
- Pandas: 70 min, avg confidence 0.6

Generated files:
- ch03_output/raw_learning_log.csv
- ch03_output/clean_learning_log.csv
- ch03_output/cleaning_log.json
- ch03_output/learning_log.sqlite3
- ch03_output/topic_minutes.svg
- ch03_output/report.html
If your output matches the counts, the pipeline is working.
Step 4: Read the generated evidence
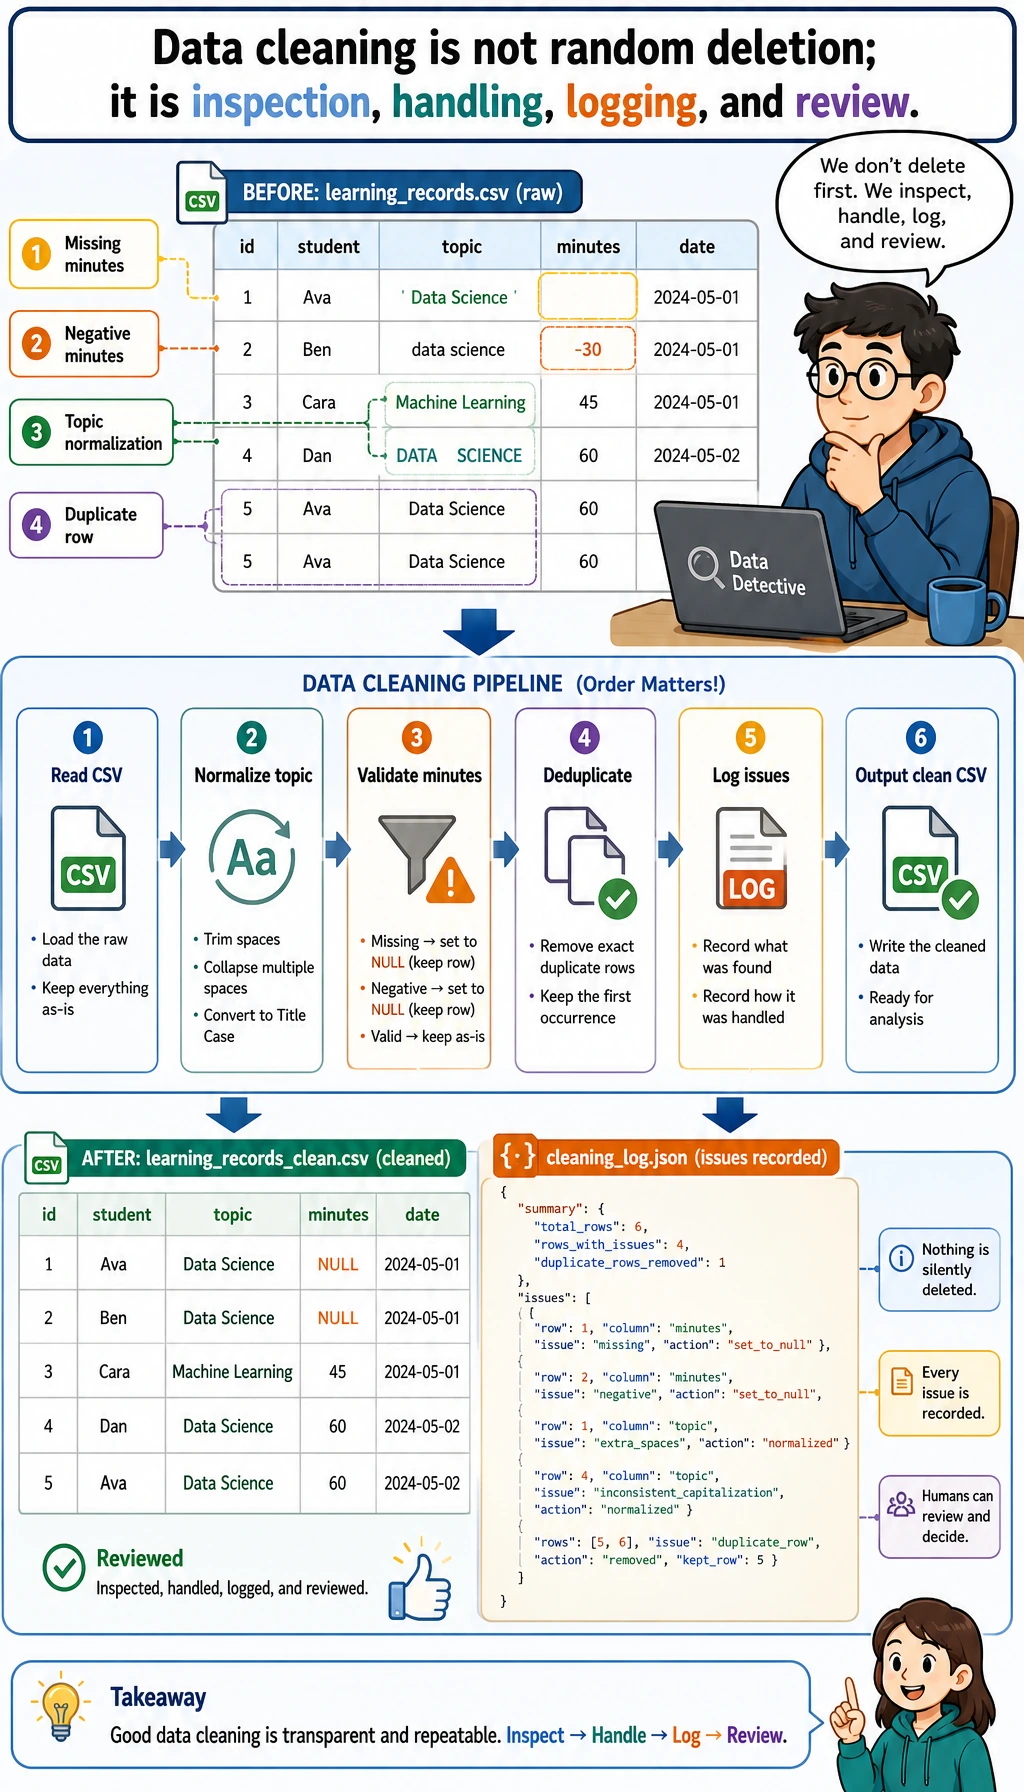
Open ch03_output/cleaning_log.json first. It should show three dropped rows: one missing minutes, one negative minutes, and one duplicate record. This file is important because data cleaning without a record is hard to trust later.
Then inspect the cleaned CSV:
python3 - <<'PY'
import csv

with open("ch03_output/clean_learning_log.csv", encoding="utf-8", newline="") as file:
    rows = list(csv.DictReader(file))

print(rows[0])
print("rows:", len(rows))
PY
Expected output:
{'date': '2026-05-01', 'topic': 'Python', 'minutes': '45', 'status': 'completed', 'confidence': '0.92', 'note': 'loops and conditions'}
rows: 9
Now query the SQLite database directly:
python3 - <<'PY'
import sqlite3

with sqlite3.connect("ch03_output/learning_log.sqlite3") as conn:
    for row in conn.execute("SELECT topic, SUM(minutes) FROM learning_logs GROUP BY topic ORDER BY SUM(minutes) DESC"):
        print(row)
PY
Expected output:
('Python', 150)
('Visualization', 115)
('Pandas', 70)
('SQL', 35)
('RAG', 25)
Step 5: Open the chart and report
Open the HTML report:
# macOS
open ch03_output/report.html

# Windows PowerShell
start ch03_output/report.html

# Linux
xdg-open ch03_output/report.html
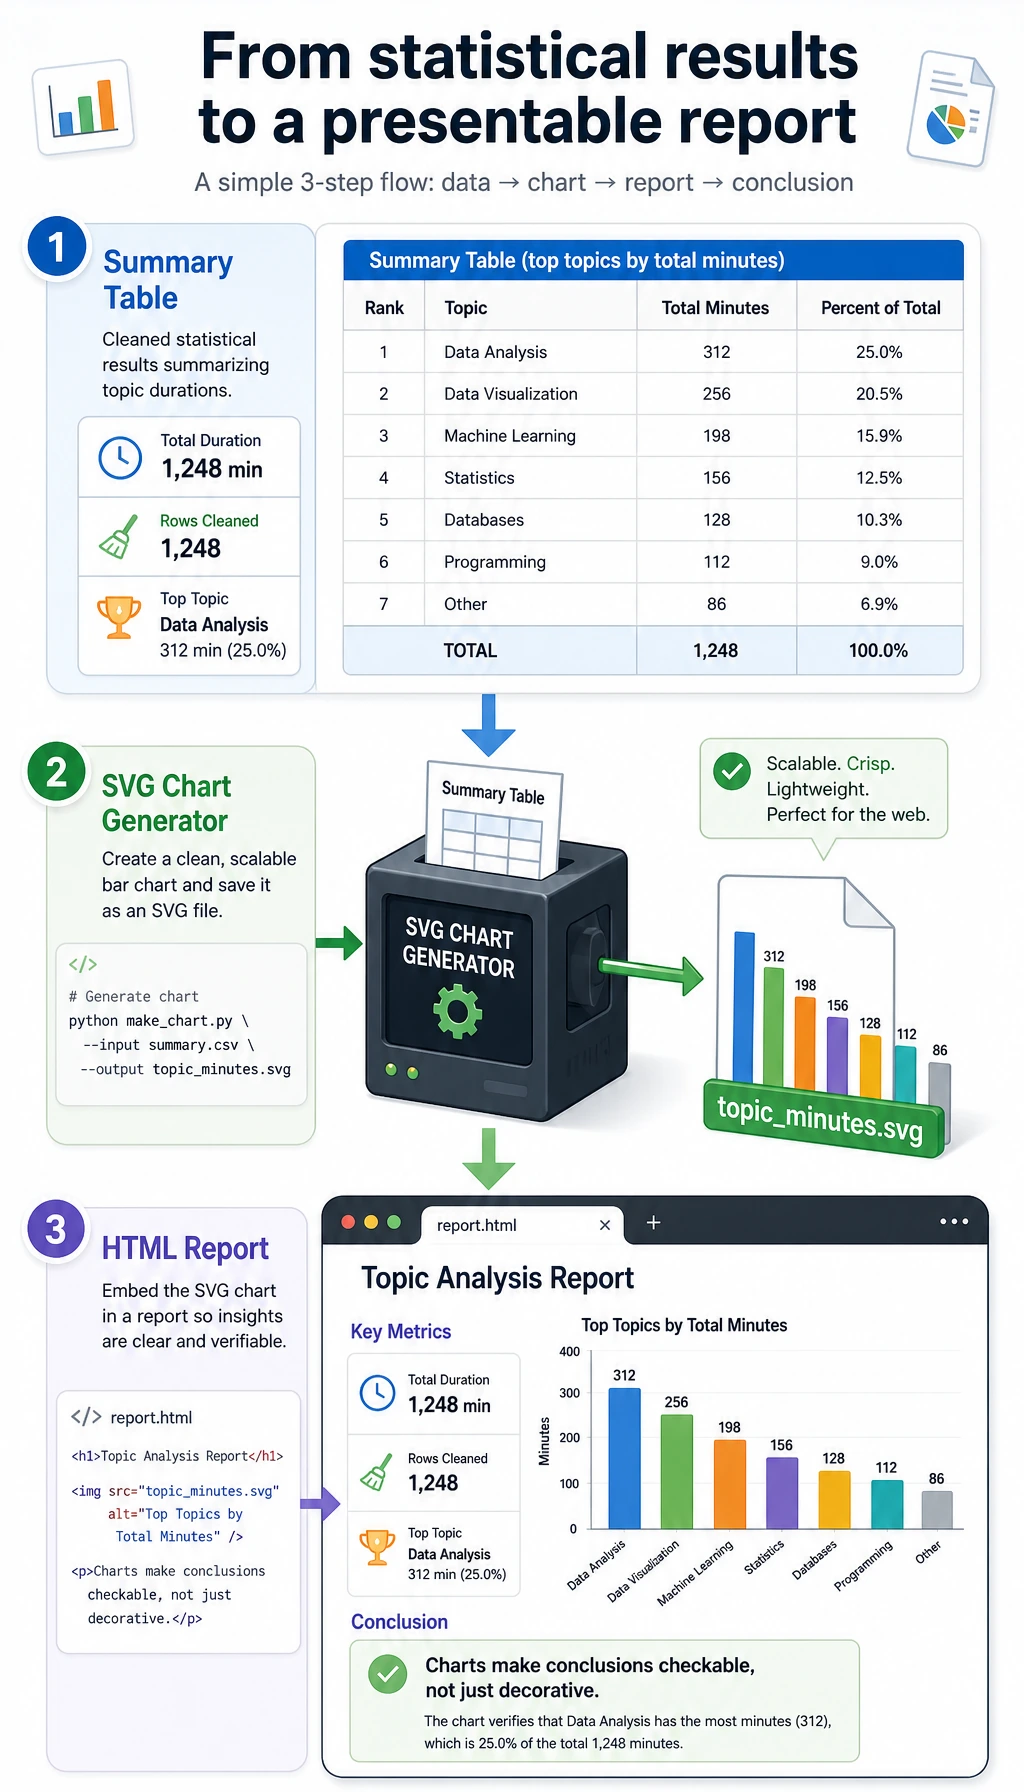
The report is intentionally simple. Its purpose is not visual polish; its purpose is to prove that every number can be traced back to a cleaned row and every conclusion can be checked.
Why these concepts matter
| Term | Beginner-friendly meaning |
|---|---|
CSV | A plain-text table file. It is easy to inspect, but it does not enforce data quality. |
cleaning log | A record of what changed during cleaning and why. It protects your conclusion from becoming a black box. |
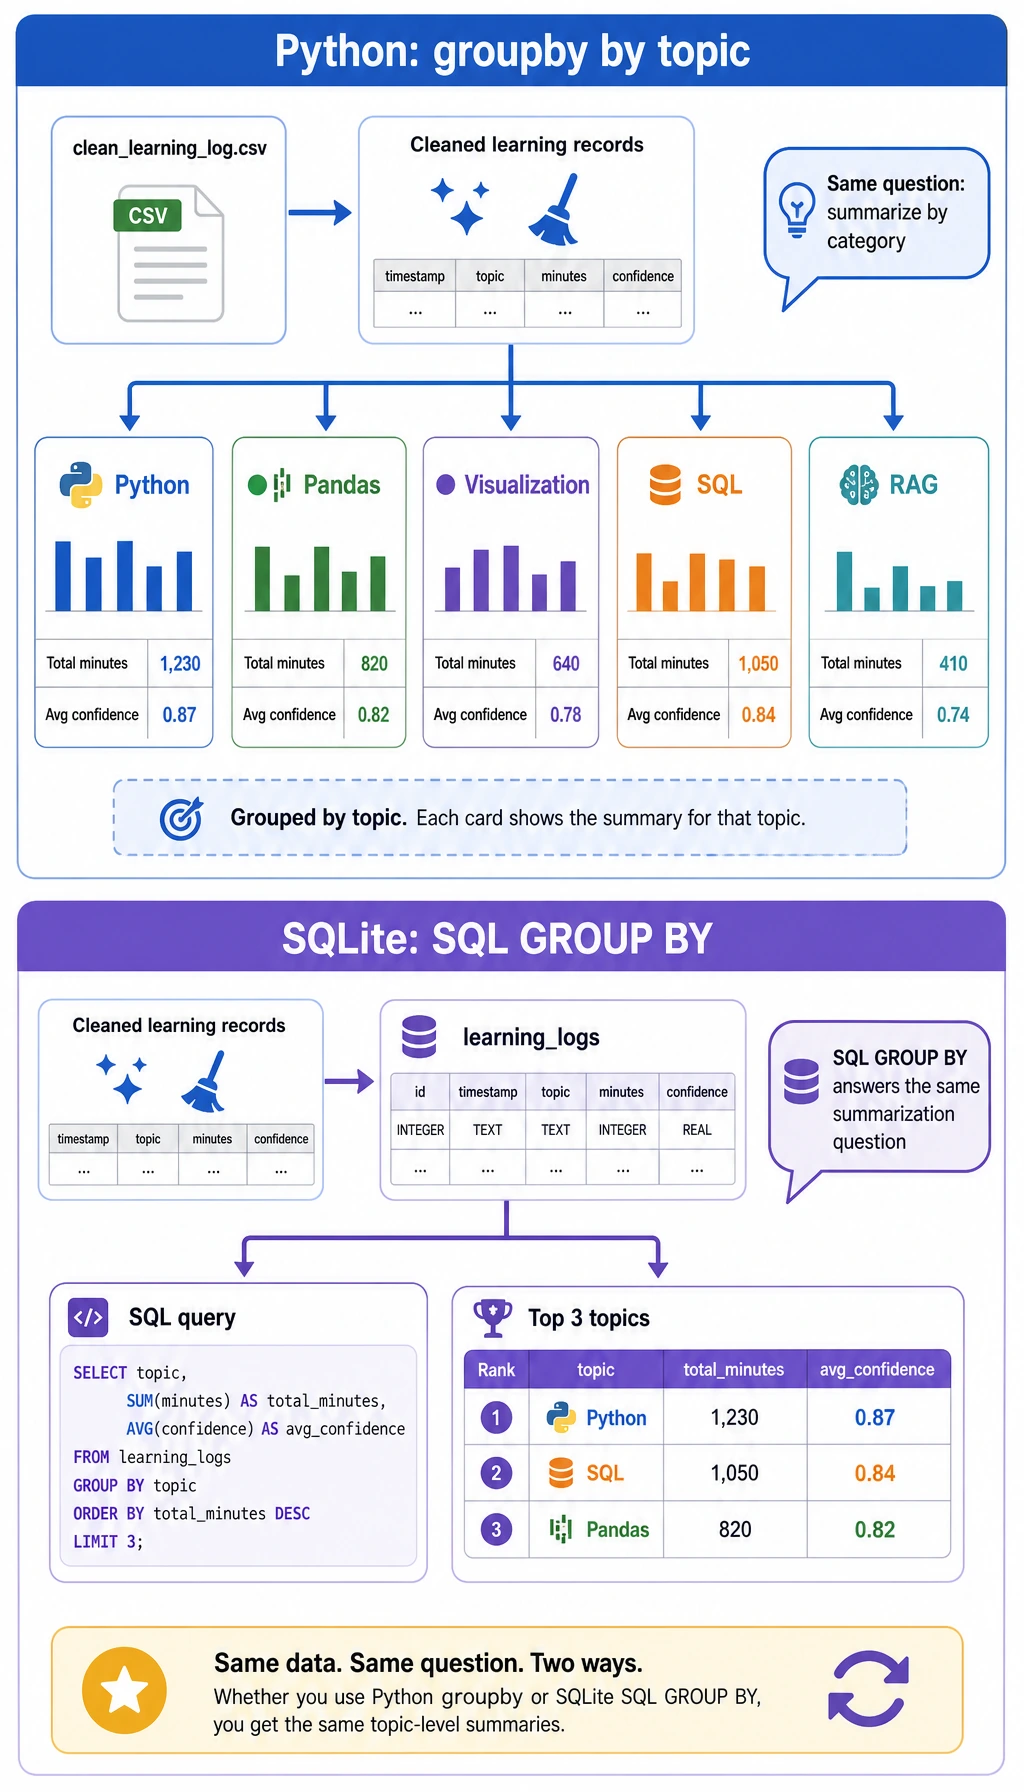
grouped statistics | Split rows by a category, calculate a metric for each group, then compare groups. |
SQLite | A small file-based relational database included with Python through sqlite3. |
SVG | A text-based image format. Here we generate a chart without installing a plotting library. |
| reproducibility | Another person can run the same script and get the same files and numbers. |
Common mistakes and fixes
| Problem | Likely cause | Fix |
|---|---|---|
python3: command not found | Your system uses python instead of python3 | Run python --version, then use python learning_log_pipeline.py |
| Output count is different | The script was edited accidentally | Copy the script again and rerun from a clean folder |
report.html opens but chart is missing | The HTML file was moved away from topic_minutes.svg | Keep both files inside ch03_output/ |
| SQLite query returns old data | A previous database file was reused by another script | This script drops and recreates the table; rerun the whole script |
| You know the API but not the conclusion | You focused on methods, not evidence | Read cleaning_log.json, clean_learning_log.csv, and report.html in that order |
Mini exercises
- Add a new row for
Machine Learningwithminutesgreater than0, rerun the script, and check whether the chart changes. - Add a row with
confidenceequal to1.2. Confirm thatparse_confidence()clips it to1.0. - Change the SQLite query to show only rows where
status = 'stuck'. - Add a new field named
difficultyand include it in the CSV, SQLite table, and report. - Rewrite
summarize_by_topic()with Pandas after you finish the Pandas section, then compare the result with this standard-library version.
Portfolio evidence checklist
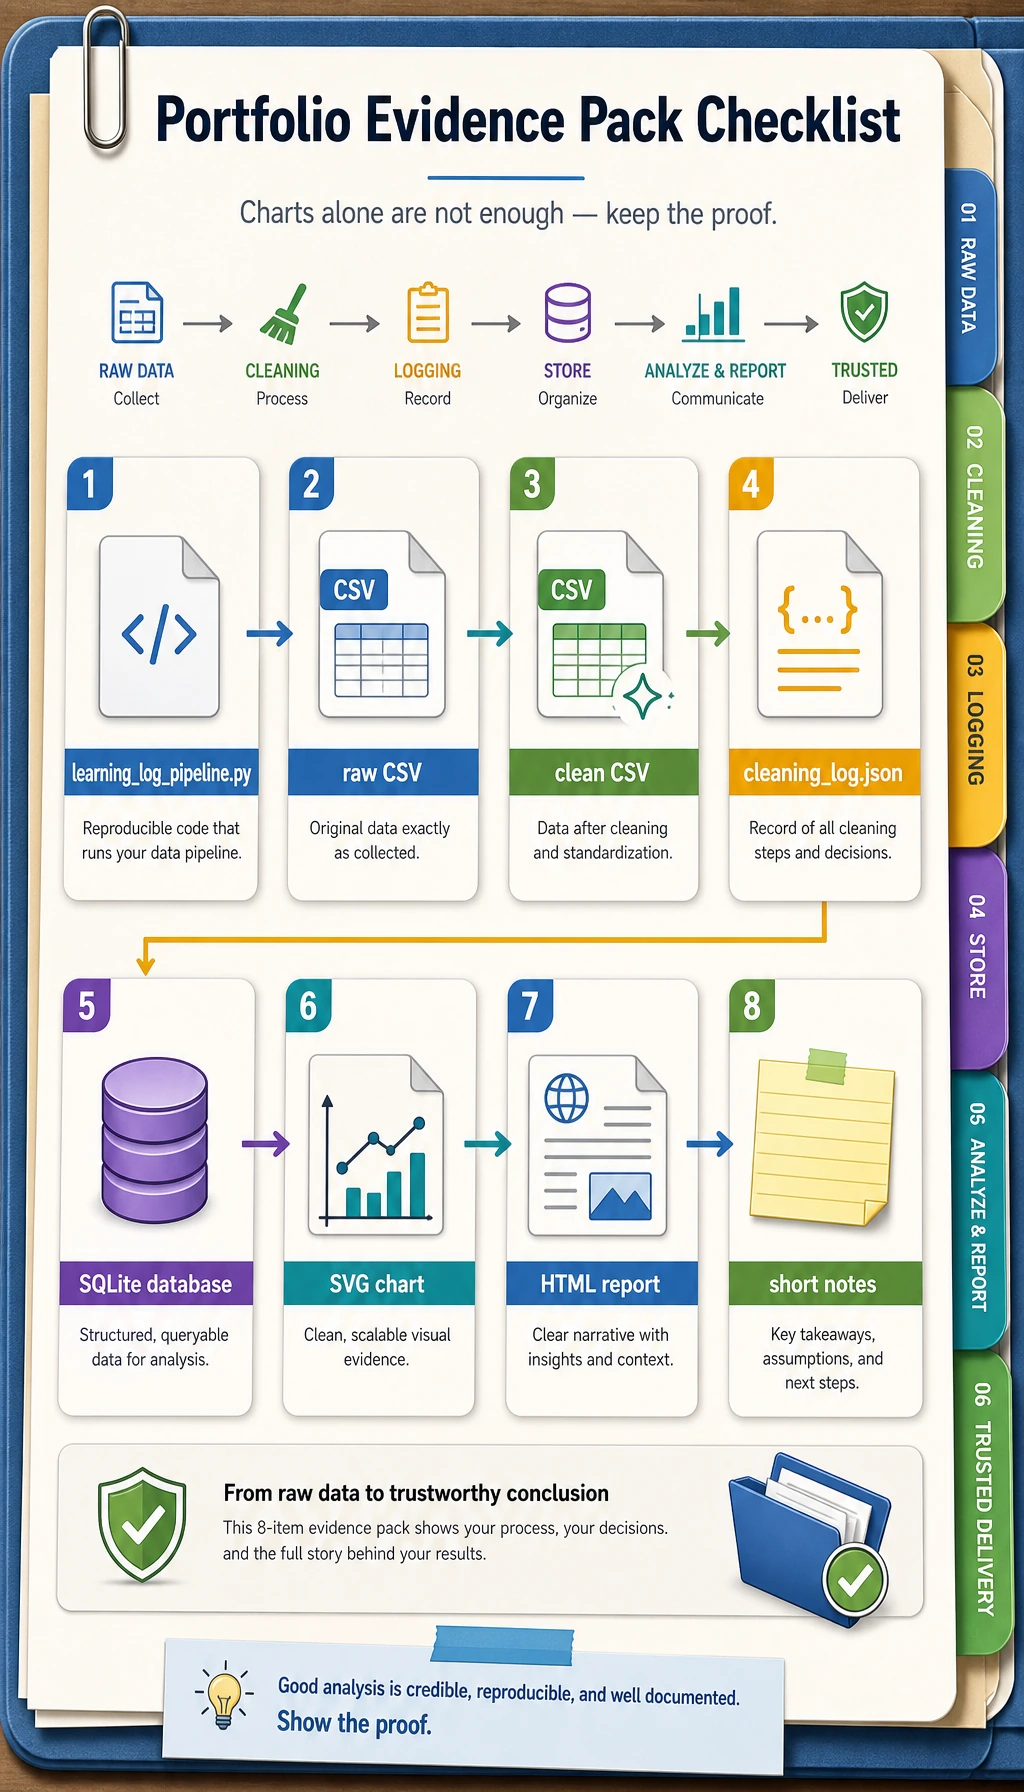
When you use this workshop as portfolio practice, keep these materials:
- The script:
learning_log_pipeline.py - The raw input:
raw_learning_log.csv - The cleaned output:
clean_learning_log.csv - The cleaning record:
cleaning_log.json - The database:
learning_log.sqlite3 - The chart:
topic_minutes.svg - The report:
report.html - A short note explaining what was dropped, which topic ranked first, and what you would analyze next
This is the minimum professional habit for data work: do not only show the final chart; show the path that made the chart trustworthy.